. 2024 Aug 16;170(8):001488. doi: 10.1099/mic.0.001488

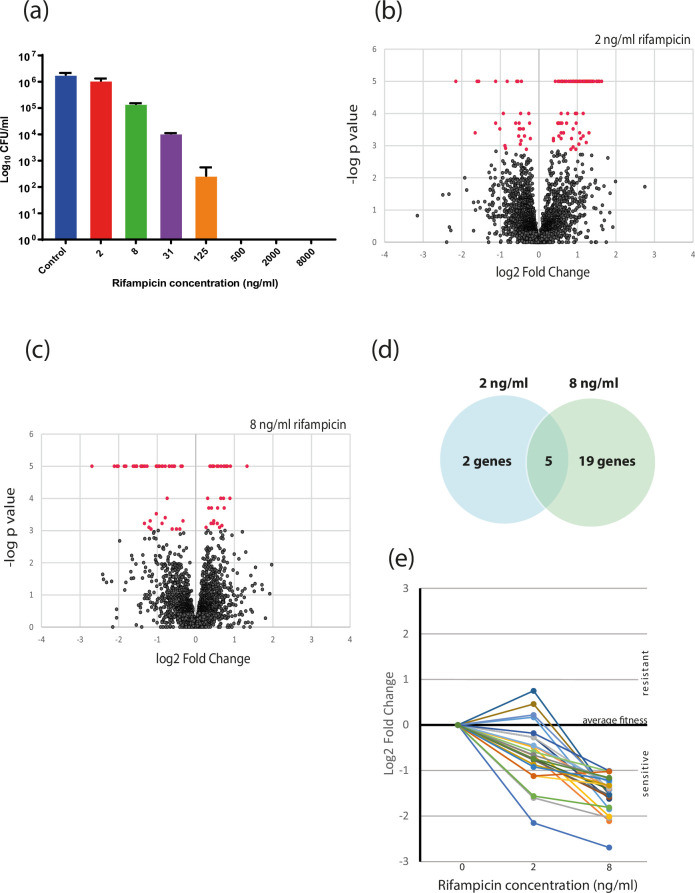
Fig. 2. Selection of rifampicin-sensitive M. bovis BCG mutants. (a) Determination of minimum inhibitory concentration (MIC) and sub-MIC of rifampicin for M. bovis BCG. Bacterial cultures were serially diluted, and spot dilutions were made on 7H11 agar with the respective rifampicin concentrations. Colonies were enumerated after 3 weeks. Graph shows the mean of three biological replicates and error bars are one SD. (b) and (c), TnSeq assessment of BCG mutant fitness in sub-MIC rifampicin. Volcano plots show the relationship between fold change and fdr-adjusted P values derived by the TRANSIT Resampling test of TnSeq reads from pools of BCG mutants selected on 2 ng ml−1 and 8 ng ml−1 rifampicin respectively. Mutations in genes with an adjusted P value<0.05 were deemed to have significantly different survival/fitness are coloured red. (d) Overlap in mutants with significantly increased sensitivity to rifampicin at 2 and 8 ng ml−1. (e) Dose response of rifampicin sensitive mutants. The fold change in survival at 2 ng ml−1 and 8 ng ml−1 rifampicin was plotted for all mutants (n=24) which had at least a two-fold reduction on 8 ng ml−1 rifampicin and an adjusted P value<0.05.

Fig. 2.