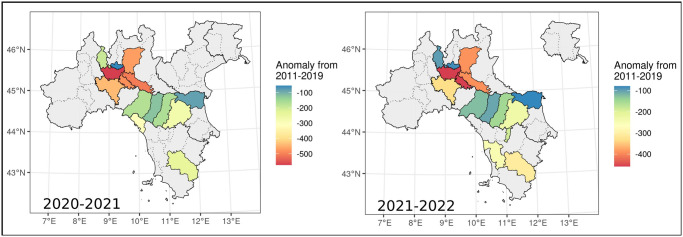
Fig 2. Difference between the observed number of hunting licenses and predictions from 2011–2019 data, during the 2020–2021 season (left) and the 2021–2022 season (right).
Anomalies are expressed as the difference between the median value of the posterior distribution, which in Bayesian models represent the most probable value, and observed values. Provinces in grey did not have any anomalous variation. Administrative boundaries were downloaded from the Italian National Institute of Statistics and are subjected to a CCBY 4.0 license (https://www.istat.it/note-legali/).

