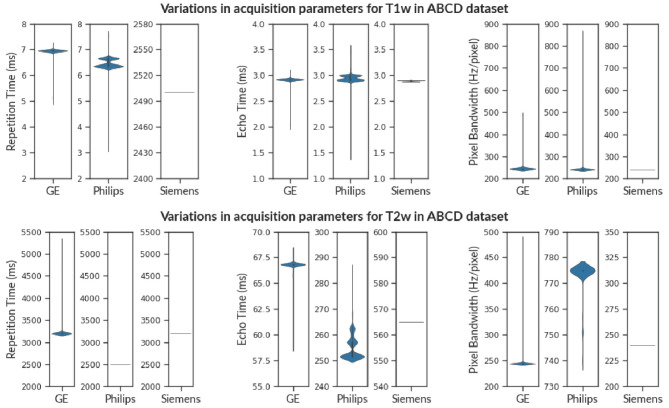
Fig. 3.
The violin plot shows the variance in Repetition Time (TR), Echo Time (TE), and Pixel Bandwidth (PB) for T1w images (above) and T2w images (below) in the ABCD Dataset. Observe that various vendors have a distinct range of acquisition parameters e.g. Repetition Time (T1w) and Echo Time (T2w). This is because different vendors provide distinct imaging sequences even though the modality might be the same (T1w). Therefore, checking cross-vendor compliance is non-trivial. We observe that scans from Siemens have consistent acquisition parameters in contrast to scans from Philips and GE scanners for both T1w and T2w images

