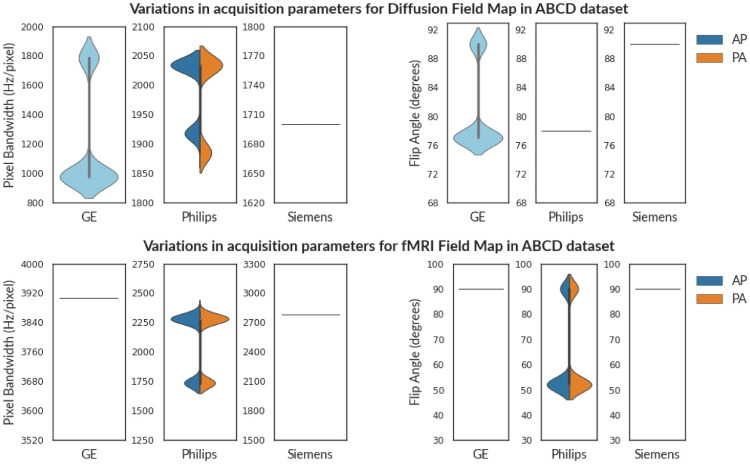
Fig. 5.
The violin plot shows the variance in Flip Angle(FA) and Pixel Bandwidth (PB) for Diffusion (above) and fMRI (below) field maps in the ABCD Dataset. Siemens and Philips scanners had distinct fieldmaps each annotated with a PED (AP/PA). However, sequences from GE scanners (denoted by cyan) were not annotated in the ABCD dataset. In contrast to scans from Philips and GE scanners, MR scans from Siemens have consistent acquisition parameters across both diffusion and fMRI field maps

