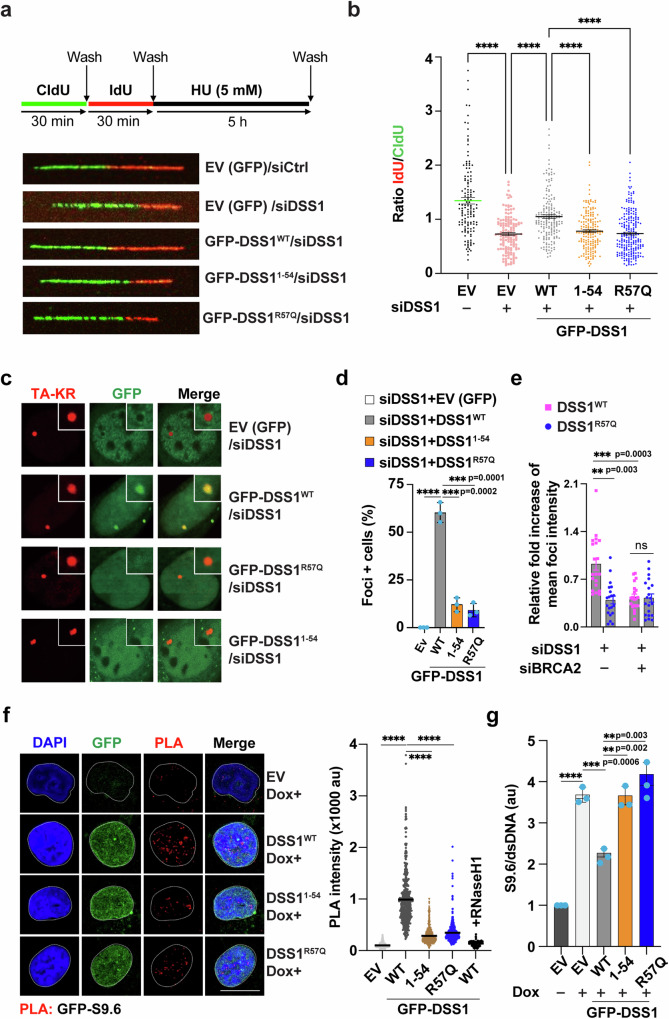
Fig. 6. Requirement of DSS1 C-terminal Helix in Replication Fork Protection and R-loop Resolution.
(See also Supplementary Figs. 11, 12). a Schematic of replication fork stability assay with CldU and IdU labeling (top) and representative micrographs of fiber events in HeLa cells with stable expression of EV (GFP), GFP-DSS1WTres, GFP-DSS11-54res, or GFP-DSS1R57Qres (bottom). Endogenous DSS1 was depleted by siRNA against DSS1. b Dot plots of IdU to CldU tract length ratios for individual replication forks in HU-treated cells. The median value of 130–220 CldU and IdU tracts from three independent experiments. Data represent mean ± SEM. Statistical analysis was performed using the two-sided student's t-test with ****p < 0.0001. c U2OS-TRE cells transfected with pBROAD3 TA-KR and the expression vector of EV(GFP), GFP-DSS1WT, GFP-DSS11–54, or GFP-DSS1R57Q were light-activated and recovered 20 min before fixation. Representative images of GFP foci recruitment at sites of KR in each group were shown. d Foci-positive cells in each indicated group in Fig. 6c at sites of TA-KR were quantified (n = 30). The mean values ± SD of three independent experiments is shown, ****p ≤ 0.0001 (two-sided students t-test). e Fold increase of GFP-DSS1WT and GFP-DSS1R57Q foci intensity at sites of TA-KR compared to background was quantified (n = 10, mean ± SD) under the treatment of siDSS1 and siBRCA2. Statistical analysis was done with the two-sided students t-test, ns not significant. f Representative micrographs of PLA foci (red) of DSS1 (α-GFP) and R-loop (S9.6) in the nuclei of HeLa-shDSS1 cells stably expressing GFP-DSS1WTres, GFP-DSS11-54res or GFP-DSS1R57Qres after the treatment of CPT (10 μM; 2 h) (left). Blue: DAPI. Green: GFP-DSS1. The foci formation was analyzed over 200 cells using ImageJ. Symbol: EV empty vector with GFP. au arbitrary unit. Scale bar: 10 μm. Average values (±SEM) of PLA intensity for 500 nuclei from three independent experiments (right) were plotted. Statistical analysis was done with the two-sided student's t-test, ****P ≤ 0.0001. g Quantification (mean ± SEM) of enrichment of R-loop (detected by S9.6 antibody) into genomic DNA of HeLa-shDSS1 cells stably expressing GFP-DSS1WTres, GFP-DSS11-54res, or GFP-DSS1R57Qres after the treatment of CPT (10 μM; 2 h). au arbitrary unit. Statistical analysis was done from three independent experiments with the two-sided student's t-test, ****p ≤ 0.0001. Source data are provided as a Source Data file.

