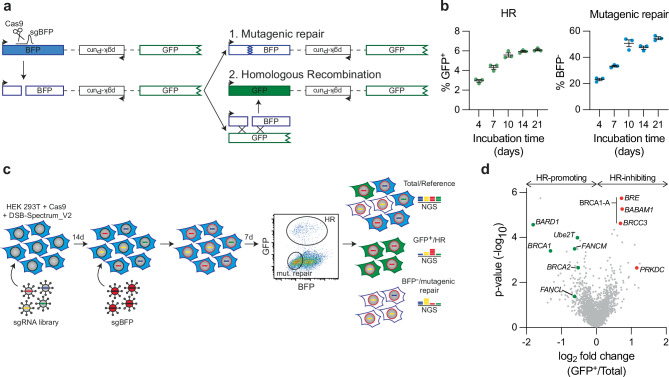
Fig. 1. A targeted CRISPR screen in DSB-Spectrum reporter cells identifies FANCM, Ube2T and FANCL as HR-promoting factors.
a Schematic of the DSB-Spectrum_V2 reporter. Adapted from van de Kooij et al.17. BFP=Blue Fluorescent Protein, GFP=Green Fluorescent Protein. b HEK 293T+ Cas9 + DSB-Spectrum_V2 cells were lentivirally infected to express mCherry and the BFP sgRNA targeting the DSB-Spectrum_V2 reporter locus. Next, at indicated time points, BFP and GFP expression were analyzed by flow cytometry. Depicted is the mean ± SEM of a technical triplicate. HR homologous recombination. c Schematic displaying the CRISPR screen layout in HEK 293T + Cas9 + DSB-Spectrum_V2 cells. NGS next-generation sequencing. d Volcano plot showing the gene targets of sgRNAs that were either enriched or depleted from the GFP+ HR population as compared to the reference population. BRCA1/BARD1, BRCA2, and Ube2T/FANCM/FANCL are indicated in green as HR-promoting factors. BRE/BABAM1/BRCC3, all members of the BRCA1-A complex, and PRKDC are indicated in red as HR-inhibiting factors. Enrichment and statistical values were determined by MAGeCK integrated into the BASDaS screening data analysis interface (n = 3 independent biological replicates)81,82. Source data are provided as a Source Data file.

