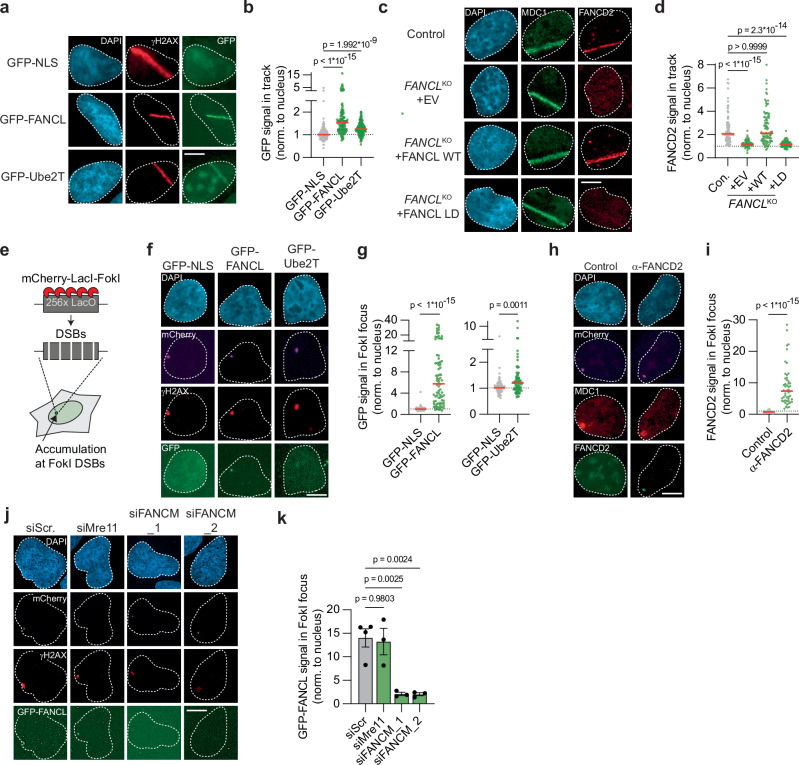
Fig. 4. FANCL, Ube2T and FANCD2 are recruited to DNA double-strand breaks.
a, b U2OS cells expressing either GFP-NLS, GFP-FANCL, or GFP-Ube2T were exposed to UV-A laser micro-irradiation. Next, the GFP signal at γH2AX-positive laser-induced DNA damage tracks was analyzed by fluorescence microscopy. Shown are representative images (a) and quantification (b) of one of two independent biological replicates (scale bar = 10 μM). The dotted line is set at 1 (i.e., no recruitment to the track), red lines indicate median (n = 128, 116, 146 (NLS, FANCL, Ube2T); one-way ANOVA with post-hoc Kruskal-Wallis). c, d As in panels, but now analyzing recruitment of endogenous FANCD2 to MDC1-positive laser-induced DNA damage tracks in U2OS FANCLKO cell lines (EV = empty vector, WT = wild-type, LD = ligase-dead). Shown are representative images (c) and quantification (d) of one of two independent biological replicates (scale bar = 10 μM). Red lines indicate the median (n = 82, 56, 90, 84 (Con., + EV, + WT, + LD); one-way ANOVA with post-hoc Kruskal-Wallis). e Cartoon schematic of a DSB recruitment assay in U2OS 2-6-3 cells. f, g Accumulation of GFP-NLS, GFP-FANCL, or GFP-Ube2T at γH2AX-marked FokI-generated DSBs in U2OS 2-6-3 cells was assessed by fluorescence microscopy. Shown are representative images (f) and quantification (g) of one of two independent biological replicates (scale bar = 10 μM). GFP-FANCL and GFP-Ube2T signals are plotted in individual graphs to optimize the scaling of the Y-axis. Red lines indicate the median (n = 74, 82, 77 (NLS, FANCL, Ube2T); Mann-Whitney test, two-sided). h, i As in panels (f) and (g) but now analyzing endogenous FANCD2 recruitment to MDC1-marked FokI-induced DSBs. Primary α-FANCD2 antibody was omitted from the immuno-staining in the control sample. Shown are representative images (h) and quantification (i) of one of two independent biological replicates. Red lines indicate the median (n = 56, 50 (Control, a-FANCD2); Mann-Whitney test, two-sided). j, k As in panels (f) and (g), but including siRNA transfection. Panel (j) shows representative images (scale bar = 10 μM), and panel (k) shows the quantification of independent biological replicates (n = 4 for siScr, n = 3 for the other conditions; mean ± SEM; one-way ANOVA with post-hoc Dunnett’s). Source data are provided as a Source Data file.

