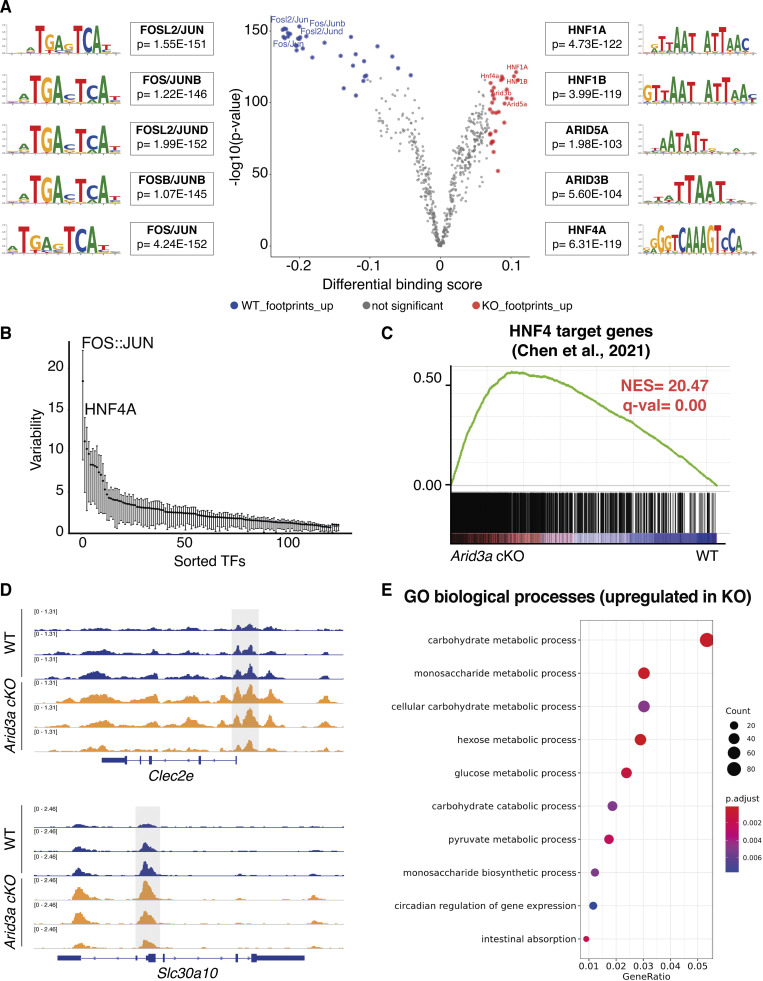
Figure 6.
Deletion of Arid3a allows HNF family of transcription factors to bind to A+T-rich regions. (A) Analysis of the ATAC-seq using the TOBIAS package (see Materials and methods). Volcano plot shows the differential binding activity against the −log10(P value) of all investigated transcription factor motifs. Each dot represents one motif; blue dots represent motif enrichment in WT; red dots represent motif enrichment in Arid3a cKO. Representative examples of Top-10 transcription factors enriched in either WT or Arid3a cKO animals are shown on the left and right side of the volcano plot, respectively. (B) Analysis of the ATAC-seq using the ChromVAR package (see Materials and methods). Plot shows TFs sorted based on their variability score. (C) GSEA of previously published gene list of HNF4 target genes. (D) Comparison of open ATAC-seq chromatin peaks of Hnf4 targets genes (Clec2e and Slc30a10) in WT and Arid3a cKO animals (tracks extracted from IGV). (E) Top 20 upregulated GO biological processes based on ATAC-seq analysis. GO was performed based on 5,000 peaks with the greatest variability between WT and KO.

