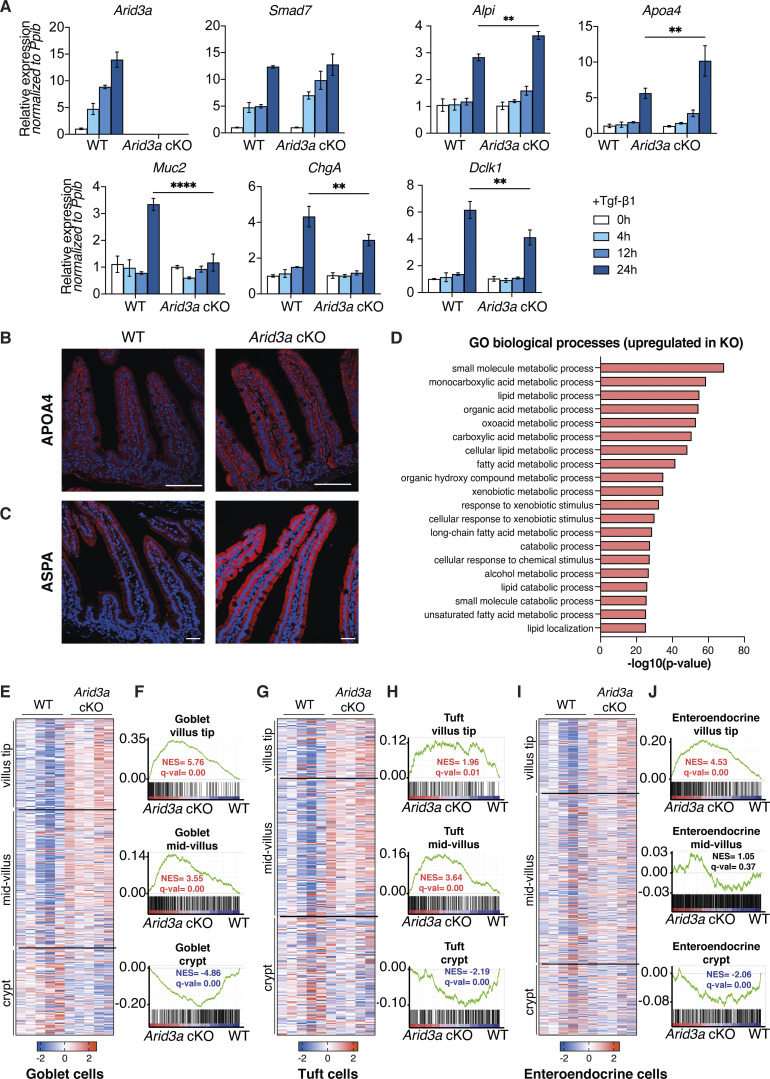
Figure S2.
Loss of Arid3a leads to disruption of enterocyte zonation. (A) qRT-PCT analysis of WT and Arid3a cKO organoids treated with recombinant TGF-β1 for 4, 12, and 24 h. Organoids were established from three biologically independent animals per group (N = 3). Data represent mean ± SEM; **P < 0.01, ***P < 0.001, two-way ANOVA. (B) Immunofluorescence staining of APOA4. Representative images from N = 5 per experimental group. Scale bar, 100 μm. (C) Immunofluorescence staining of ASPA. Representative images from N = 3 per experimental group. Scale bar, 100 μm. (D) Top 20 upregulated GO biological processes based on RNA-seq analysis. FDR < 0.05 and fold change >1.5 cut-offs were applied. (E) Heatmap of RNA-seq data of goblet cell zonated and differentially expressed genes. Z-scores are shown. FDR cut-off <0.05. (F) GSEA of all zonated goblet cell genes. (G) Heatmap of RNA-seq data of tuft cell zonated and differentially expressed genes. Z-scores are shown. FDR cut-off <0.05. (H) GSEA of all zonated tuft cell genes. (I) Heatmap of RNA-seq data of enteroendocrine cell zonated and differentially expressed genes. Z-scores are shown. FDR cut-off <0.05. (J) GSEA of all zonated enteroendocrine cell genes. For E, G, and I, genes are shown based on their center of mass with crypt genes at the bottom of the heatmap and villus tip genes at the top (based on Manco et al. [2021]).

