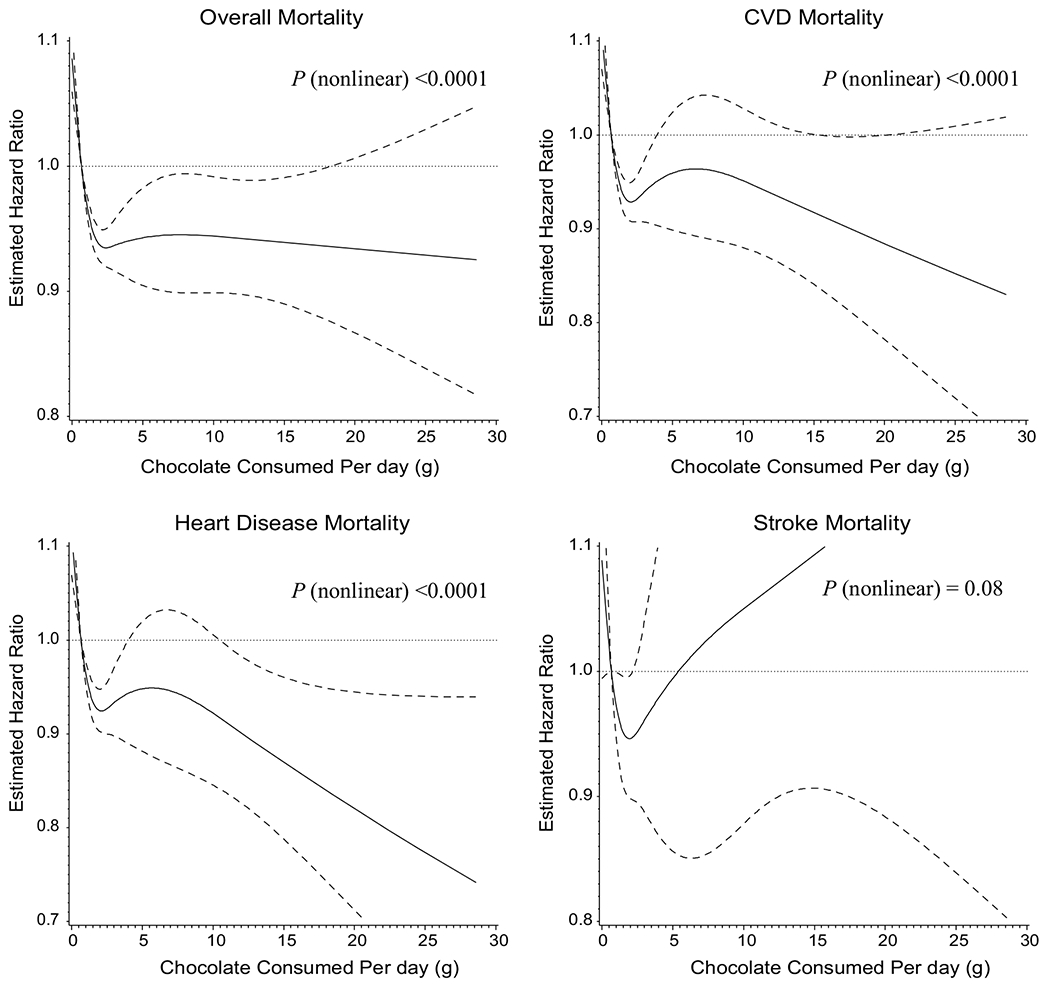
Fig. 1.

Risk of overall and cause-specific mortality according to daily chocolate consumption using cubic spline regression model. a Overall mortality. b Cardiovascular disease (CVD) mortality. c Heart disease mortality. d Stroke mortality. The solid line denotes the HR of mortality according to chocolate consumption with knot spline (four knots were selected at the 5th, 25th, 75th, and 95th percentiles of chocolate consumption; dashed lines were used to represent the 95% CIs). There were 27,111 participants in the final analyses. The number of events is 22,064, 9121, 7457 and 1625 for overall-, CVD-, heart disease- and stroke-mortality, respectively
