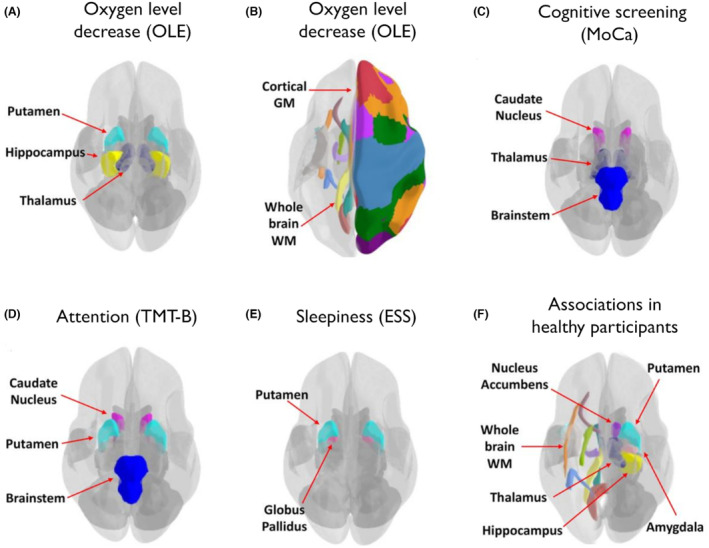
Figure 2.

Cerebral regions of interest related to cognitive and daytime sleepiness in patients with post‐COVID syndrome and healthy participants. (A, B) Regional OLE increases indicating lower oxygen level found in post‐COVID patients compared to healthy participants. Post‐COVID patient brain regional BOLD delay and/or OLE measurements (positively or negatively) associated with the (C) MoCA score, (D) with TMT‐B times and (E) with the ESS score. (F) Regional OLE measures and BOLD delay times (positively or negatively) associated with the FSMC total score and/or ESS in healthy participants. Colours in the image are based on different regional parcellations from different atlases, for example, different WM tracts or different cortical GM regions. It should be noted that the atlas regions were not necessarily used in our study, and the MRI data were often not parcellated to such fine detailed regions in this study. BOLD, blood oxygen level dependent; ESS, Epworth sleepiness scale; FSMC, Fatigue Scale for Motor and Cognitive Functions; GM, grey matter; MoCA, Montreal Cognitive Assessment; OLE, oxygen level estimate; TMT‐B, Trail Making Test‐B; WM, white matter.
