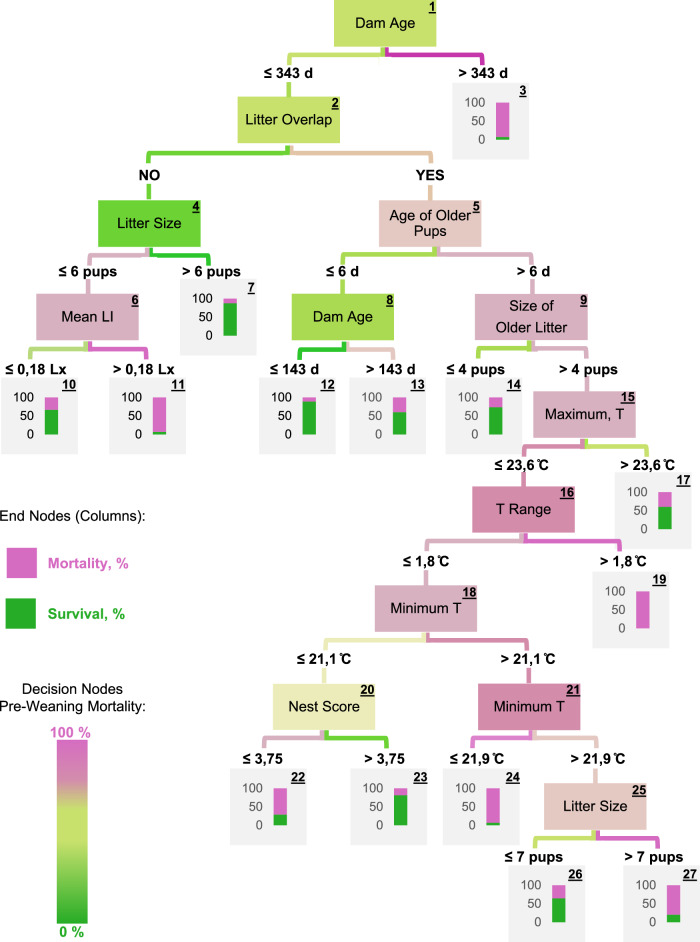
Fig. 3. Decision tree.
Description of pup death by using a total of 10 social (Dam Age, Litter Overlap, Age of Older Pups, Size of Older Litter, Size of Focal Litter) and micro-environment (Mean Light Intensity, Cage Temperature Range, Maximum and Minimum Cage Temperature, and Nest Score, on Day 0) attributes (factors) with an overall accuracy of 84.1% and a rate of correctly classified instances (TP-rate) of 80.9%. A total of 1479 instances were used in the balanced dataset and the Confusion Matrix is presented in Supplementary Table 4. T temperature, LI light intensity.

