
Fig. 2.
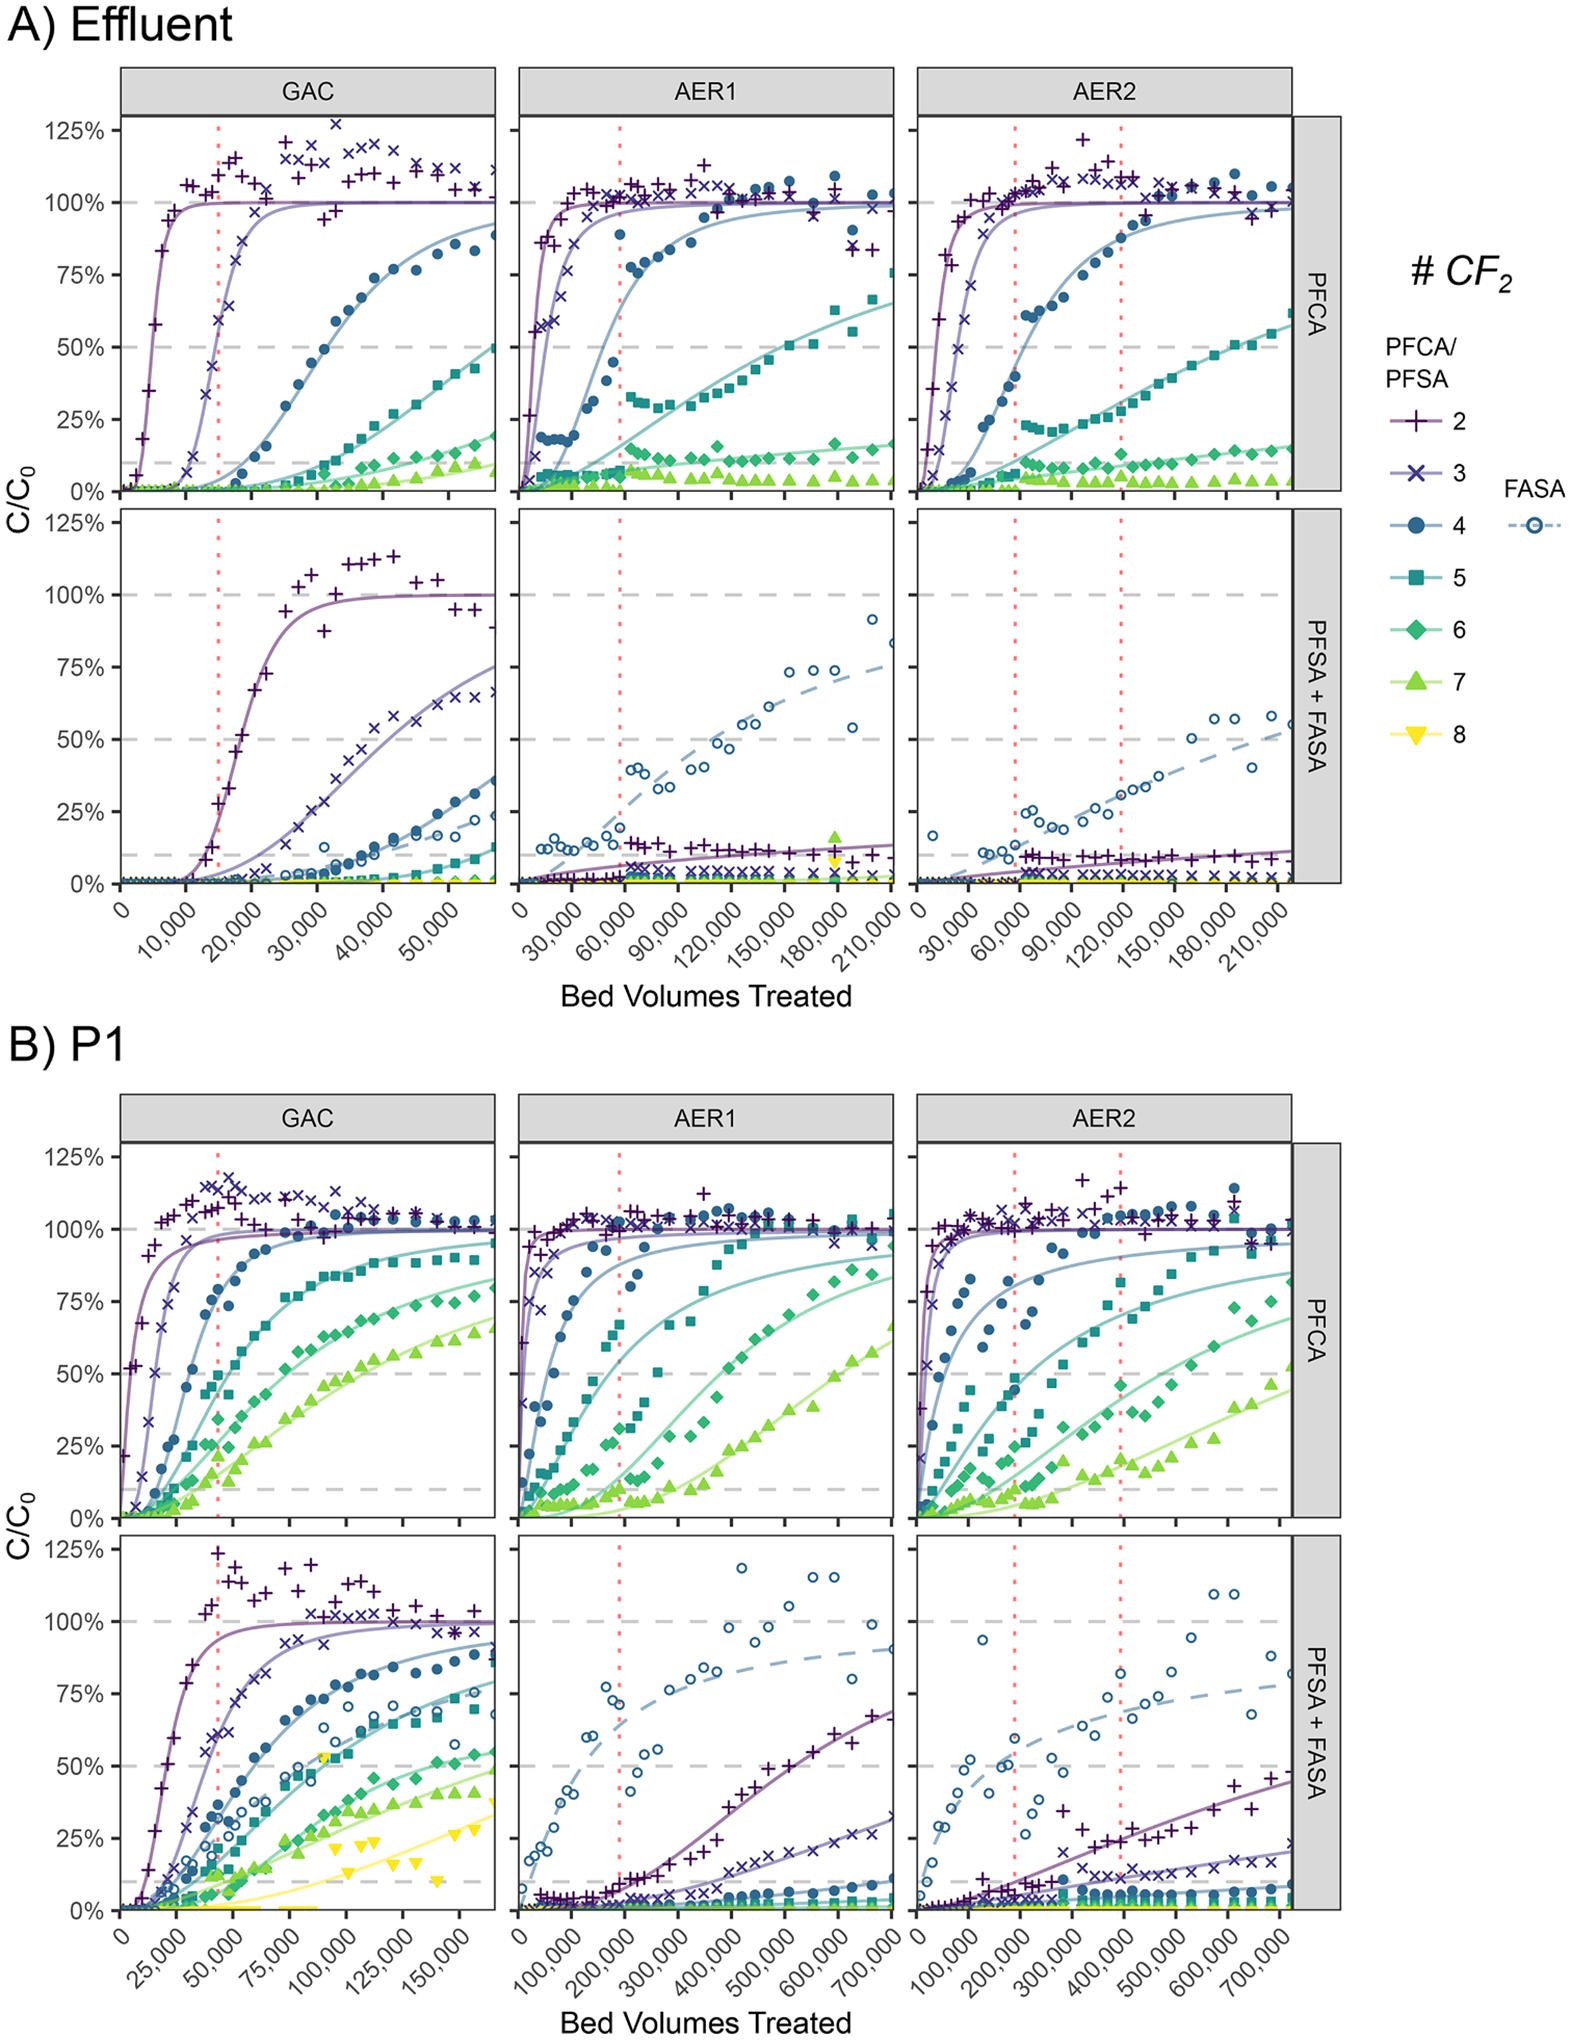
Influent-normalized breakthrough of linear PFAS in each tested column at A) effluent port (GAC EBCT=10.3 min; AER EBCT=2.7 min) and B) intermediate sample port P1 (GAC EBCT=3.6 min; AER EBCT=0.81 min). Modeled dose-response breakthrough curves are shown with measured data for visual aid. Breakthrough at 10%, 50%, and 100% are shown for reference. Dotted red vertical lines correspond to BVs of bed disruptions from pilot interruptions that led to discontinuous breaks in some breakthrough curves at days 111 and 264.