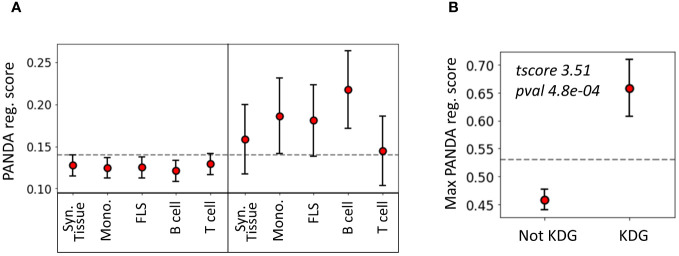
Figure 5.
Relationship between key driver analysis (KDA) and PANDA network-based TF analysis. (A) Average PANDA score of TFs identified as key driver genes and not identified by the KDA analysis for each tissue type. (B) Max PANDA score (defined as the maximum PANDA score across all cell types) for both key driver TFs and non-key drivers. The gray line represents the expected score if all TFs were randomly scored, and the error bars correspond to the 95% confidence intervals, defined as .

