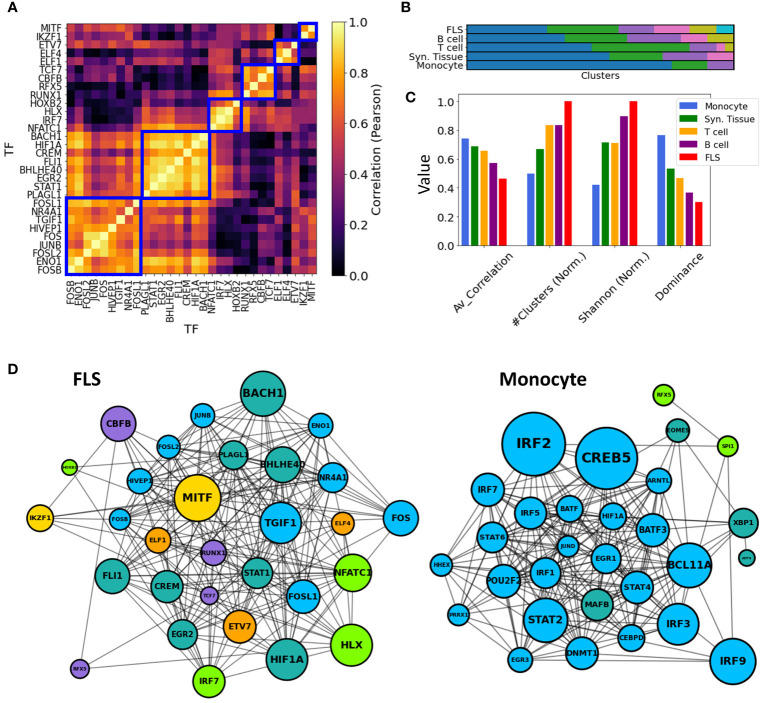
Figure 6.
TF-TF RA co-regulation network in each cell type. (A) Pairwise TF-TF co-regulation heatmap in FLS, quantified in terms of the Pearson correlation between the differential edge weight to their common target genes (Method 2.11). A hierarchical clustering approach is used to group them into clusters (depicted with a blue square). (B) The resulting clusters are visualized as a bar plot, with populations from each cluster depicted in distinct colors. (C) The networks are characterized by the average correlation of their edges, their number of clusters, and other diversity metrics (Shanon Entropy, dominance). These metrics are plotted next to each other for each cell type. For visual clarity, some metrics were normalized by their maximum values. (D) Networks show the main TFs involved in FLS and monocyte RA regulation. Edges indicate correlations exceeding the median co-regulatory scores (Methods Section 2.11). Node sizes are proportional to the node degree times TF’s regulatory score, . Node colors indicate the different co-regulatory clusters. Networks and pairwise correlation matrices are provided for all cell types in Supplementary Figure S10 .

