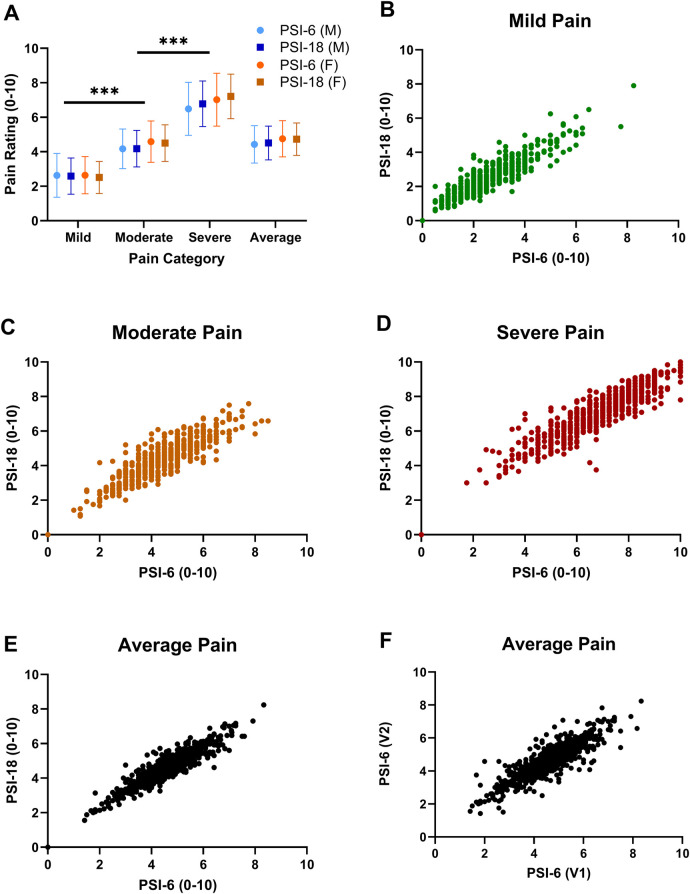
Figure 1.
Mean (SD) pain ratings are shown in panel (A) for each pain category (mild, moderate, and severe pain) and the overall average pain rating across all items with PSI-6 (circles) and the PSI-18 (squares) and males in blue and females in orange. Face validity is demonstrated as mild pain ratings were significantly less than moderate, and moderate significantly less than severe pain. Significant sex differences were also noted, but with very small overall effect sizes (p = 0.006, η2 = 0.012) and inconsistent across pain categories. Significance signified by ***p < 0.001. Panels (B–E) show scatterplots of pain ratings using PSI-6 vs. PSI-18 from cohort 1 to evaluate construct validity, where B) mild pain (green), (C) moderate pain (orange), (D) severe pain (red), and (E) overall average pain (black). In panel (F) the overall test-retest stability of the PSI-6 is shown as a scatterplot of average pain ratings obtained from visit 1 (V1) vs. visit 2 (V2) for cohort 2.

