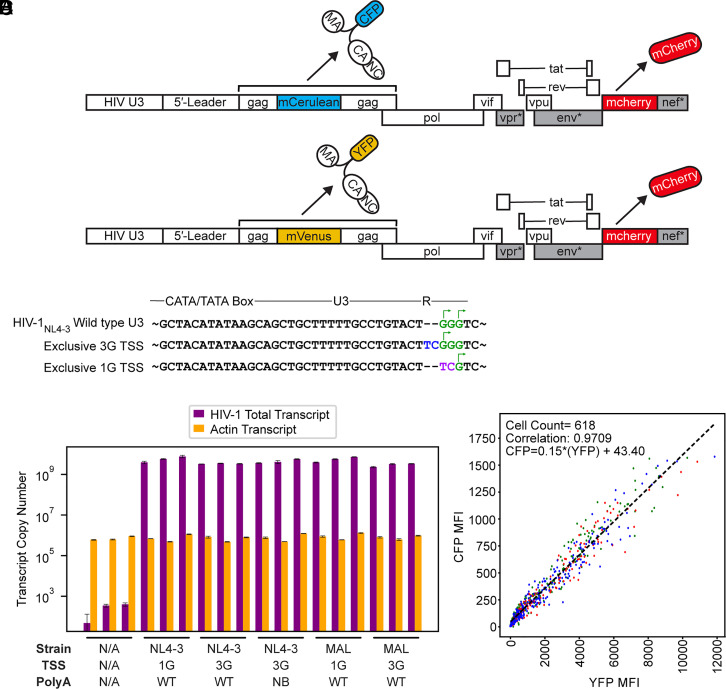
Fig. 4.
In-cell competitive assay for evaluating the effect of TTSS on translation. (A) Three color reporter system for monitoring competitive translation via cotransfection of two separate full-length proviral plasmids. Leader-driven translation was monitored by measuring changes to Gag-CFP or Gag-YFP expression over time, with mCherry also expressed by each virus as a fluid phase marker for cell tracking (* denotes inactivating mutations within gene regions intended to prohibit viral replication in vivo, for biosafety). (B) Mutations in U3 that control TSS usage (51) showing residue additions (blue), substitutions (purple), and potential and actual transcription start sites (green and arrows, respectively). (C) RT-qPCR assays for quantification of HIV-1 total transcript production (55). Error bars denote SD from three separate experiments. (D) Example of YFP versus CFP mean fluorescence intensities (MFI) used to calculate correlation coefficients (NL43-3G-YFP versus NL43-3G-CFP control at 30 h posttransfection). Each point represents an individual cell identified by Cellpose (56) with colors based on the three regions of interest (ROI) collected for each well. The best fit linear trendline is shown.

