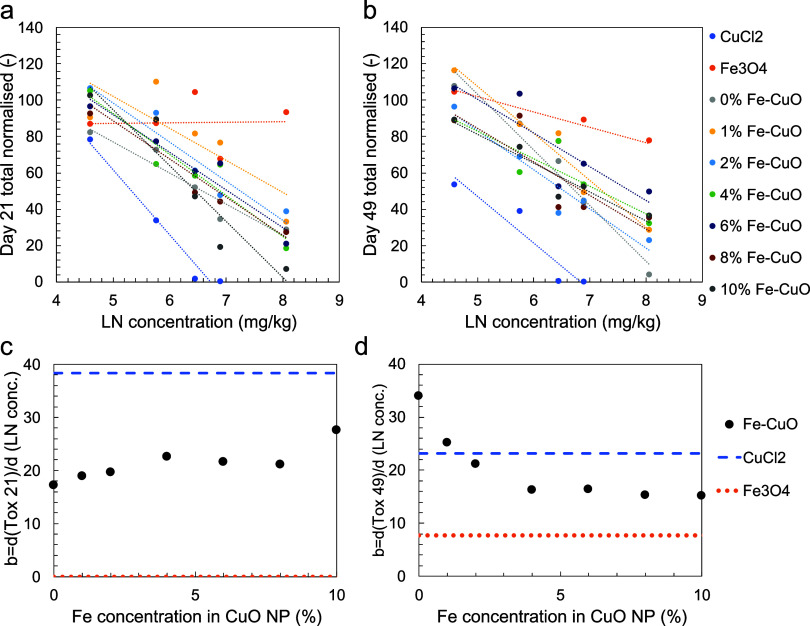
Figure 3.
Best fit of the biological response (y) to Fe-doped CuO NMs after (a) 21 days and (b) 49 days of exposure with respect to the given concentration (c). Colored dots correspond to experimental measurements; dashed lines (with the same color as the corresponding particle or substance tested) correspond to the best fitting function in the form y = −b ln c + b0. The best fitted value of the b parameter, namely, the derivative of the biological end point with respect to the natural logarithm of the concentration, is shown for (c) 21 days and (d) 49 days of exposure as a function of Fe concentration in the tested CuO NMs. See Tables S3 and S4 for a detailed list of the fitting parameters and accuracy.

