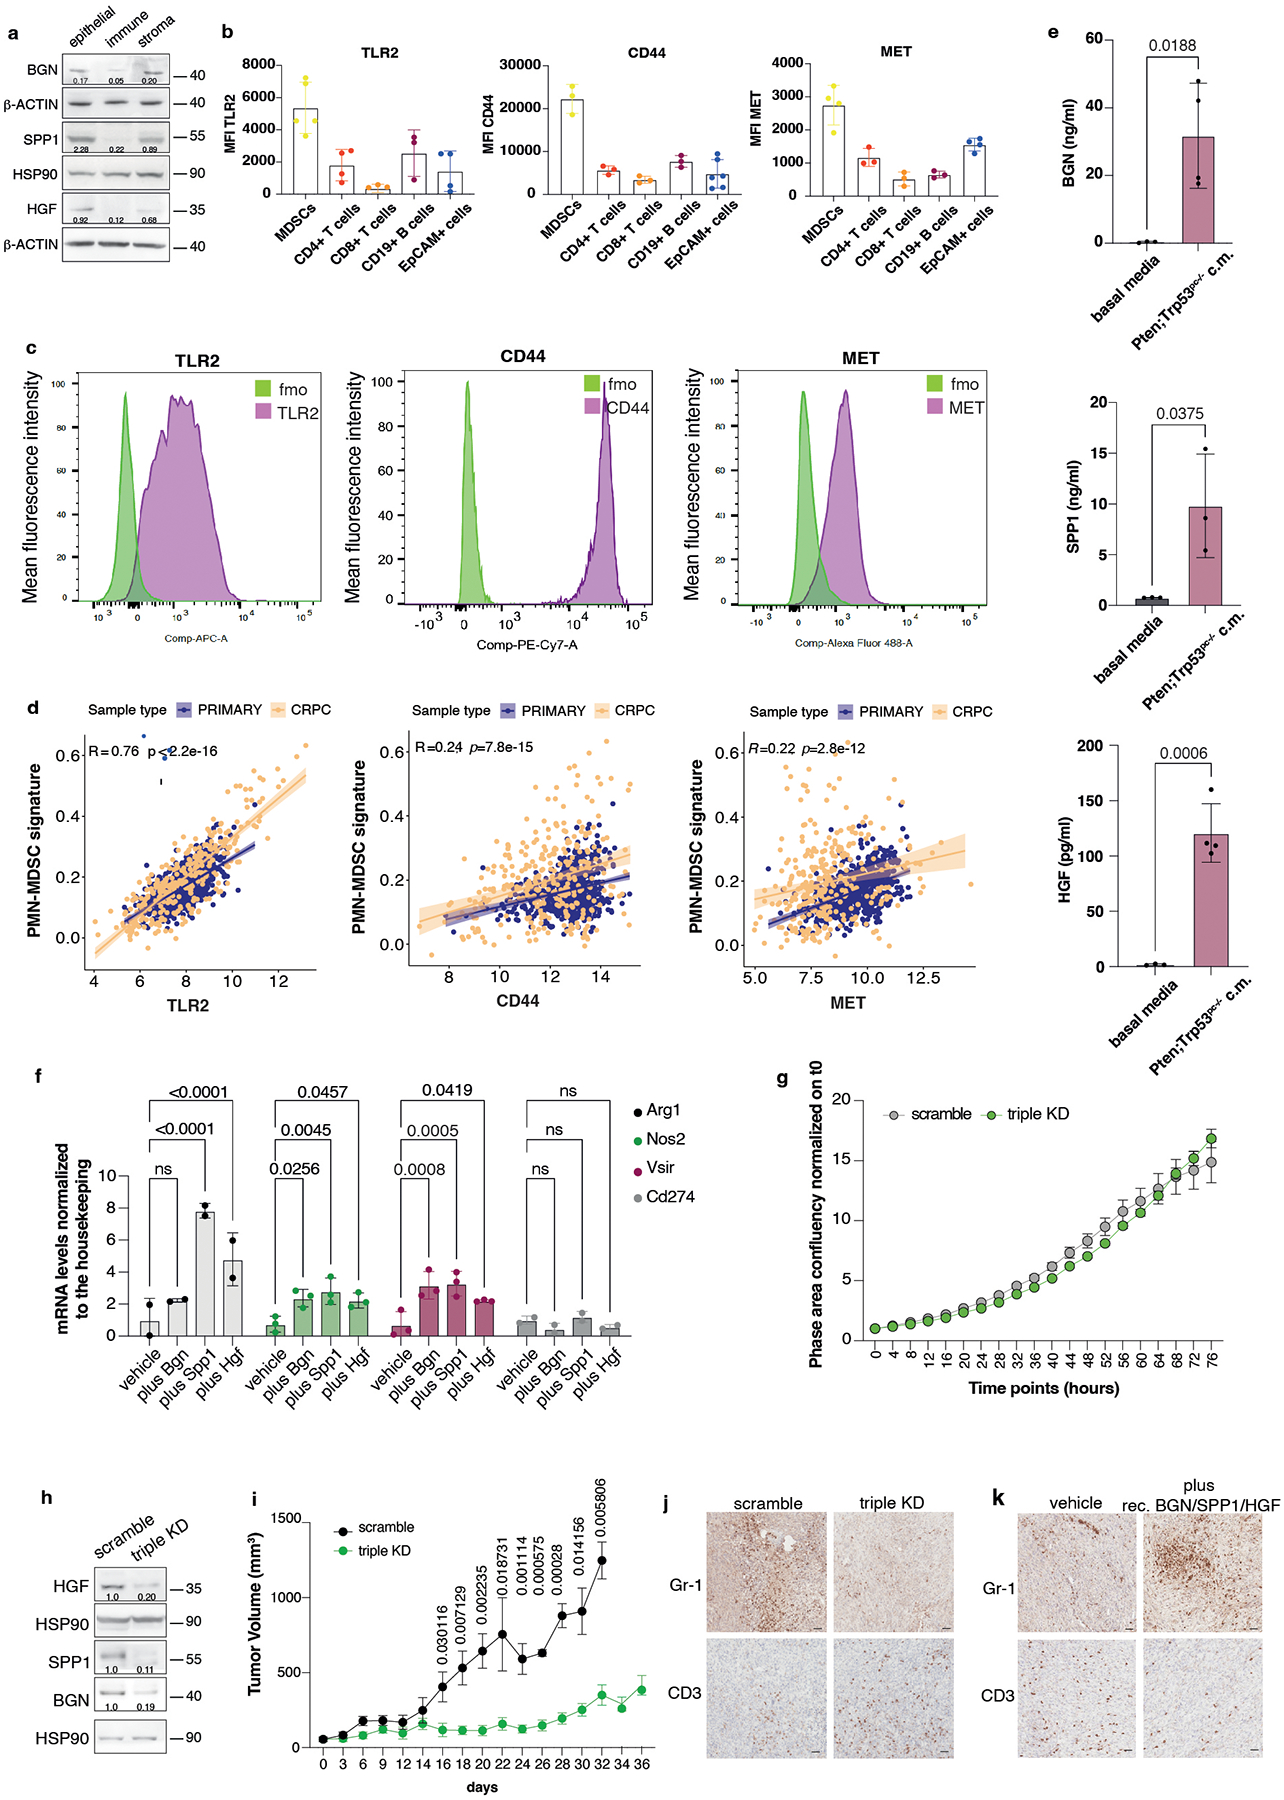
Extended Data Fig. 4. TLR2, CD44 and MET expression correlates with the PMN-MDSCs signature in human prostate cancer and CRPC.

a, Western blot showing the protein levels of BGN, SPP1 and HGF in epithelial (EpCAM+ cells), immune (CD45+ cells) and stromal fraction (EpCAM-, CD45- cells) of Ptenpc−/−;Trp53pc−/− prostate cancer. Densitometry values normalized to the respective loading control are indicated for each band. The experiment was repeated two independent times with similar results. b, Mean fluorescence intensity (MFI) of the indicated receptors in tumor-infiltrating immune cells subsets and EpCAM+ cells in Ptenpc−/−;Trp53pc−/− prostate cancers. At least n = 3 biologically independent samples. Data are mean ± SD. c, FACS plots of TLR2, CD44 and MET receptor expression in bone marrow-derived MDSCs; green signal: MDSCs stained with fluorescence minus one control, violet signal: MDSCs stained with the specific antibody. d, Correlation of TLR2 (left panel), CD44 (middle panel) and MET (right panel) expression with the PMN-MDSCs signature in primary prostate cancer and CRPC. Pearson correlation and p value are indicated at the top of the graph. TLR2: 95 % confidence interval 0.734–0.785; CD44: 95 % confidence interval: 0.180–0.295; MET: 95 % confidence interval: 0.156–0.273 e, BGN, SPP1 and HGF protein levels determined in Pten−/−;Trp53−/− (RapidCap)-derived conditioned medium by ELISA assay. n = 3 biologically independent samples. Data are mean ± SD. Statistical analysis (unpaired two-sided Student’s t-test). f, Arg1, Nos2, Vsir and Cd274 mRNA expression levels in bone marrow-derived MDSCs pretreated with recombinant BGN, SPP1 and HGF for 24 hours. n = 2 (Arg1), n = 3 (Nos2), n = 3 (Vsir), n = 2 (Cd274) biologically independent samples Data are mean ± SD. Statistical analysis (two-way ANOVA followed by Dunnett’s multiple comparisons test). g, Growth curve of scramble and Hgf/Spp1/Bgn triple KD Pten−/−;Trp53−/− (RapidCap) cells. Data are mean ± SEM. The experiment was repeated two independent times with similar results. h, Western blot showing HGF, SPP1 and BGN protein levels in scramble and triple KD Pten−/−;Trp53−/− (RapidCap)- cell lines used for the in vivo experiments. Densitometry values normalized to the respective loading control are indicated for each band. i, Tumor growth of scramble and Hgf/Spp1/Bgn triple KD in Pten−/−;Trp53−/− (RapidCap) - allografts (for all groups, n = 5 in each group). Data are mean ± SEM. Statistical analysis (multiple unpaired student t test). j, Representative IHC of Gr-1 and CD3 in scramble and Hgf/Spp1/Bgn triple KD Pten−/−;Trp53−/− (RapidCap)- allografts. Scale bar 50 μm. (n = 5 mice in each group). k, Representative IHC of Gr-1 and CD3 in vehicle-treated (n = 4 mice) and recombinant Bgn/Spp1/Hgf-treated (n = 6 mice) TRAMP-C1 allografts. Scale bar 50 μm.
