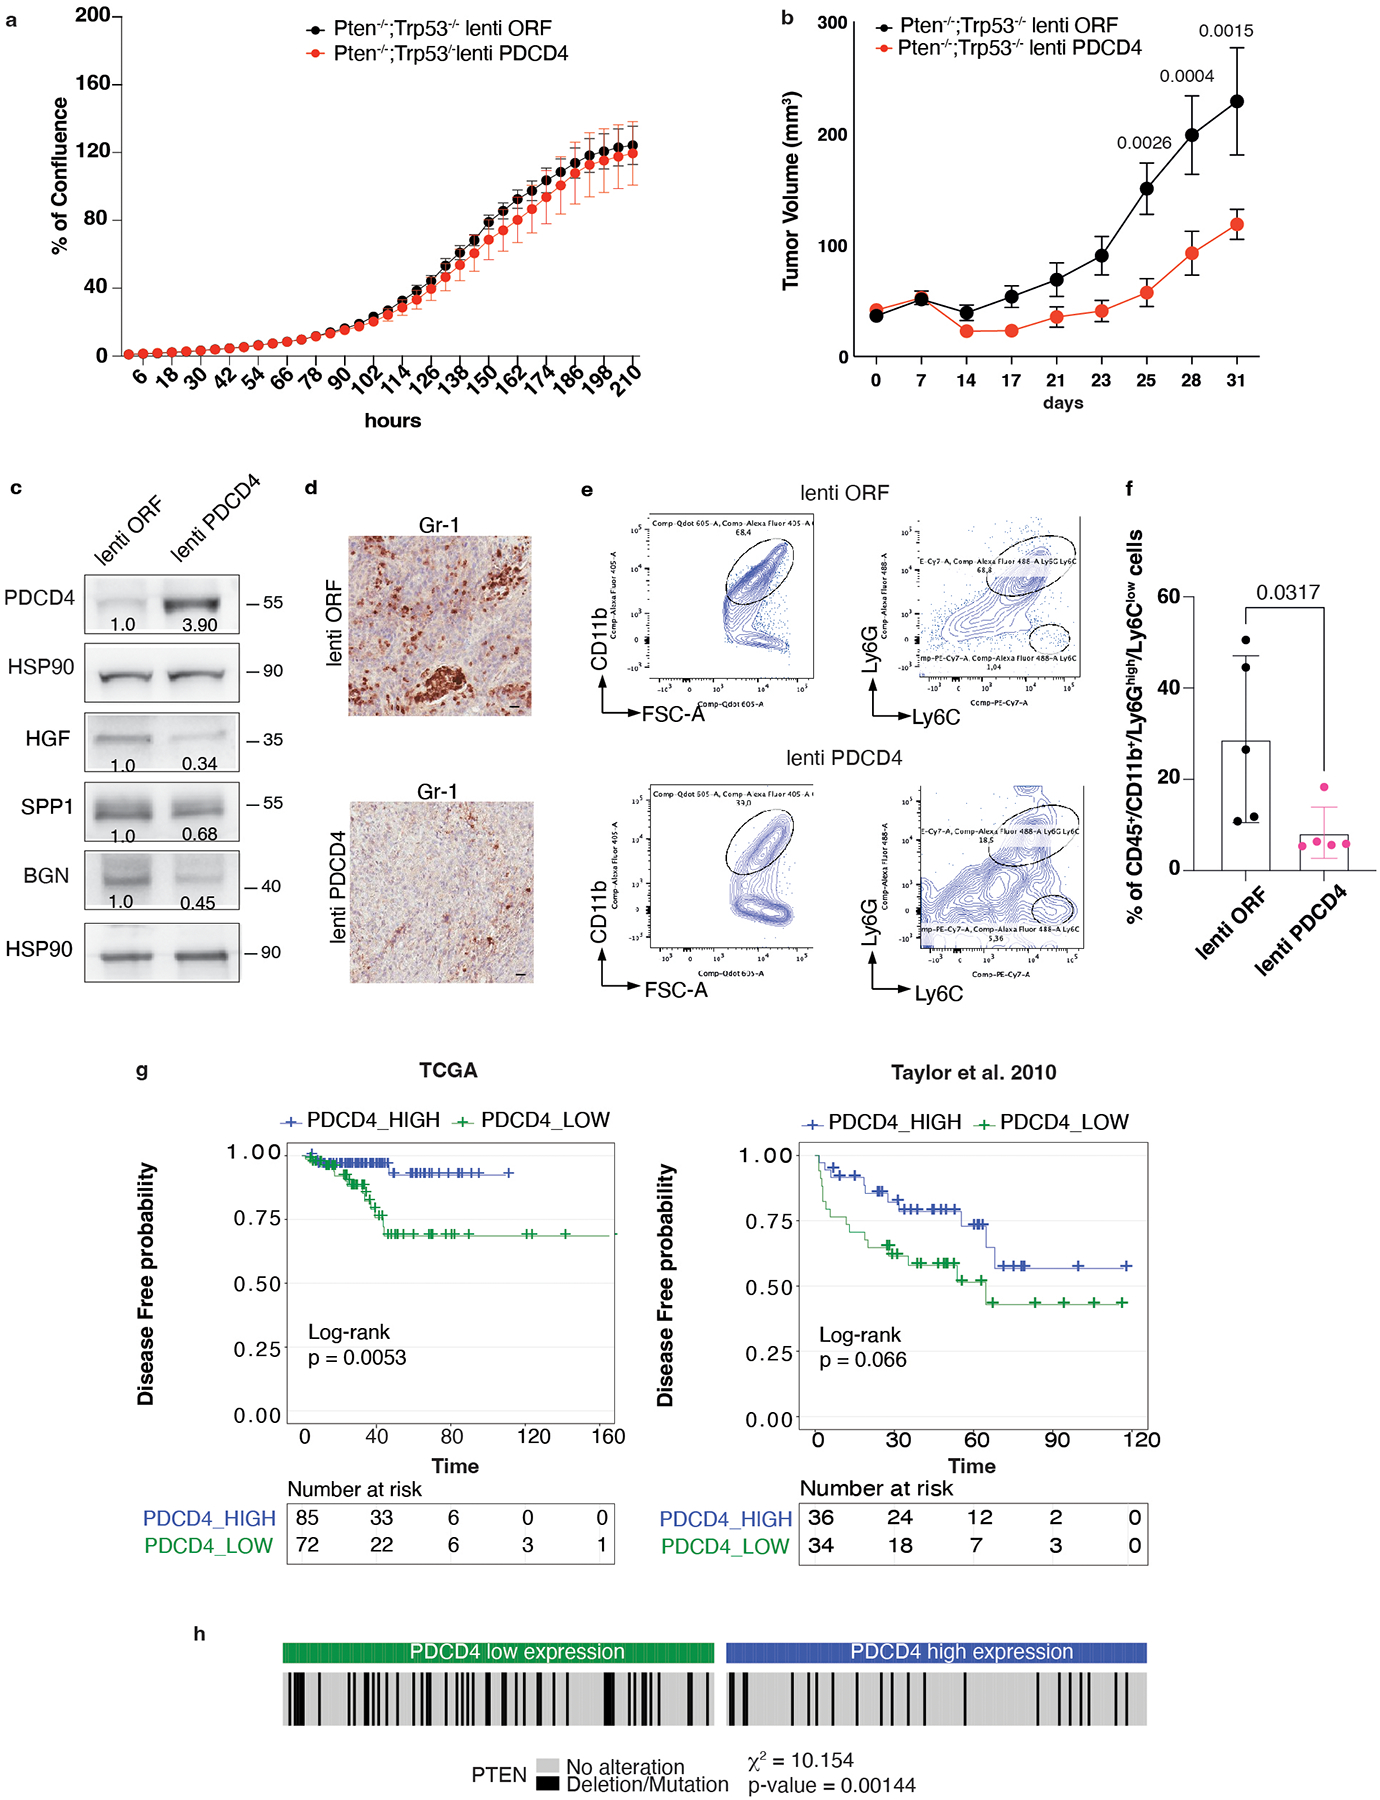
Extended Data Fig. 6. Prostate-specific Pdcd4 rescue inhibits tumor-infiltrating PMN-MDSCs and its loss is associated with decreased disease-free survival in human prostate cancer.

a, Growth curve of control vector (lenti ORF) and PDCD4 -overexpressing (lenti PDCD4) Pten−/−;Trp53−/− (RapidCap) prostate cancer cells, determined by the Incucyte system. Data are mean ± SEM. The experiment was repeated two independent times with similar results. b, Tumor growth of C57BL6 mice injected with 2.5 × 10⁶ control vector or PDCD4 -overexpressing Pten−/−;Trp53−/− (RapidCap) prostate cancer cells (lenti ORF n = 10; lenti Pdcd4 n = 7 mice). Data are mean ± SEM. Statistical analysis: (two way ANOVA followed by Šídák’s multiple comparisons test). c, Western blot showing the protein levels of PDCD4, SPP1, HGF, BGN and representative HSP90 in control vector and PDCD4 -overexpressing Pten−/−;Trp53−/− (RapidCap) murine prostate cancer cells. Densitometry values normalized to the housekeeping are indicated for each band. The experiment was repeated two independent times with similar results. d, Representative IHC of Gr-1-positive cells in control vector or PDCD4 -overexpressing Pten−/−;Trp53−/− (RapidCap) allografts. Scale bar 50 μm. (n = 5 mice in each group). e, Representative FACS plot of CD45+/CD11b+/Ly6Ghigh/Ly6Clow cells (PMN-MDSCs) inside the CD45+/CD11b+ population. f, Percentage of tumor-infiltrating CD45+/CD11b+/Ly6Ghigh/Ly6Clow (PMN-MDSCs) in control vector and PDCD4-overexpressing Pten−/−;Trp53−/− (RapidCap) allografts determined by flow cytometric analysis (n = 5 mice in each group). Data are mean ± SD. Statistical analysis (Mann-Whitney test). g, Correlation between PDCD4 mRNA levels and disease-free probability in the indicated human prostate cancer datasets. h, Correlation between PDCD4 mRNA expression levels and Pten deletion/mutation in the human prostate cancer TCGA dataset. Statistical analysis: chi-square test.
