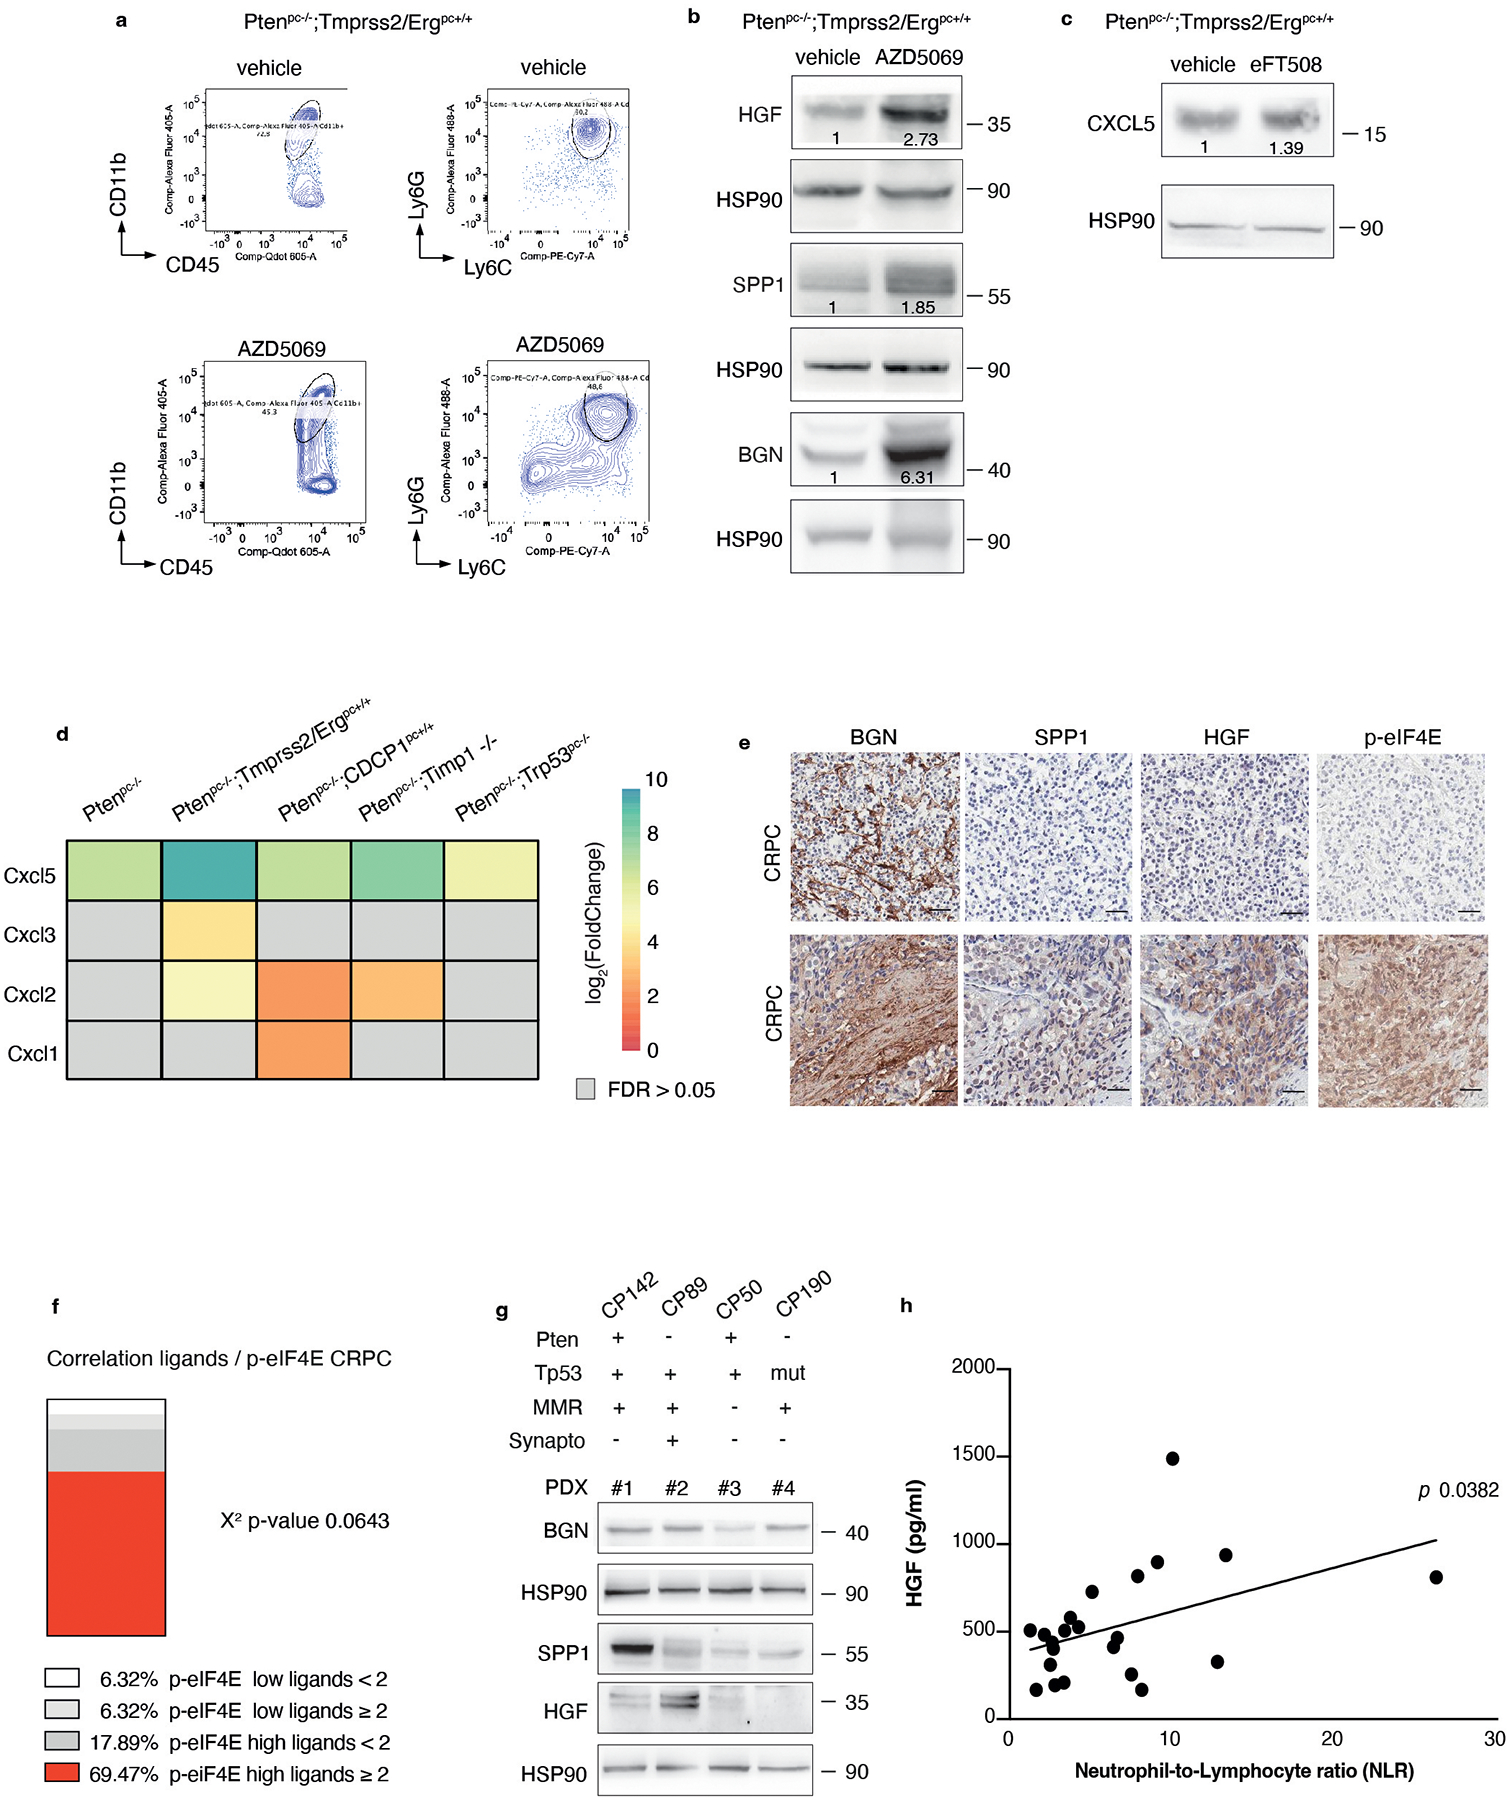
Extended Data Figure 10. BGN, SPP1 and HGF are highly expressed in CRPC and correlate with p-eIF4E protein levels.

a, Representative FACS plots of CD45+/CD11b+ population and Ly6Ghigh/Ly6Clow cells (PMN-MDSCs) inside the CD45+/CD11b+ population in AZD5069-treated and vehicle-treated Ptenpc−/−;Tmprss2/Ergpc+/+. b, Western blot analysis showing the protein levels of HGF, SPP1 and BGN in Ptenpc−/−;Tmprss2/Ergpc+/+ prostate tumors upon treatment with vehicle or AZD5069. Densitometry values normalized to the housekeeping are indicated for each band. The experiment was performed once. c, Western blot analysis showing the protein levels of CXCL5 in Ptenpc−/−;Tmprss2/Ergpc+/+ prostate tumors upon treatment with vehicle or eFT508. Densitometry values normalized to the housekeeping are indicated for each band. The experiment was repeated two independent times with similar results. d, Heatmap depicting the mRNA levels of CXCL-chemokines in prostate tumors of the indicated genotypes compared to wild-type prostates (total mRNA expression determined by RNA-seq; n = 3 mice for each genetic background). e, Representative IHC of BGN, SPP1, HGF and p-eIF4E showing negative (upper panel) and positive (lower panel) cases in CRPC in cohort 1. Scale Bar 50 μm. f, Correlation between the co-expression of ≥ 2 ligands and p-eIF4E in CRPC in cohort 1 (n = 101). Two-sided Fisher’s exact test. g, Western blot showing the protein levels of BGN, SPP1 and HGF and representative HSP90 in CRPC patient-derived xenografts. (n = 4). h, Correlation between plasma HGF levels (pg/ml), determined by ELISA assay, and neutrophil-to-lymphocyte ratio (NLR) in CRPC patients. Statistical analysis: simple linear regression.
