
Fig. 5. eFT508 treatment inhibits tumor growth and PMN-MDSCs infiltration in Ptenpc−/−; Trp53pc−/− prostate cancer.
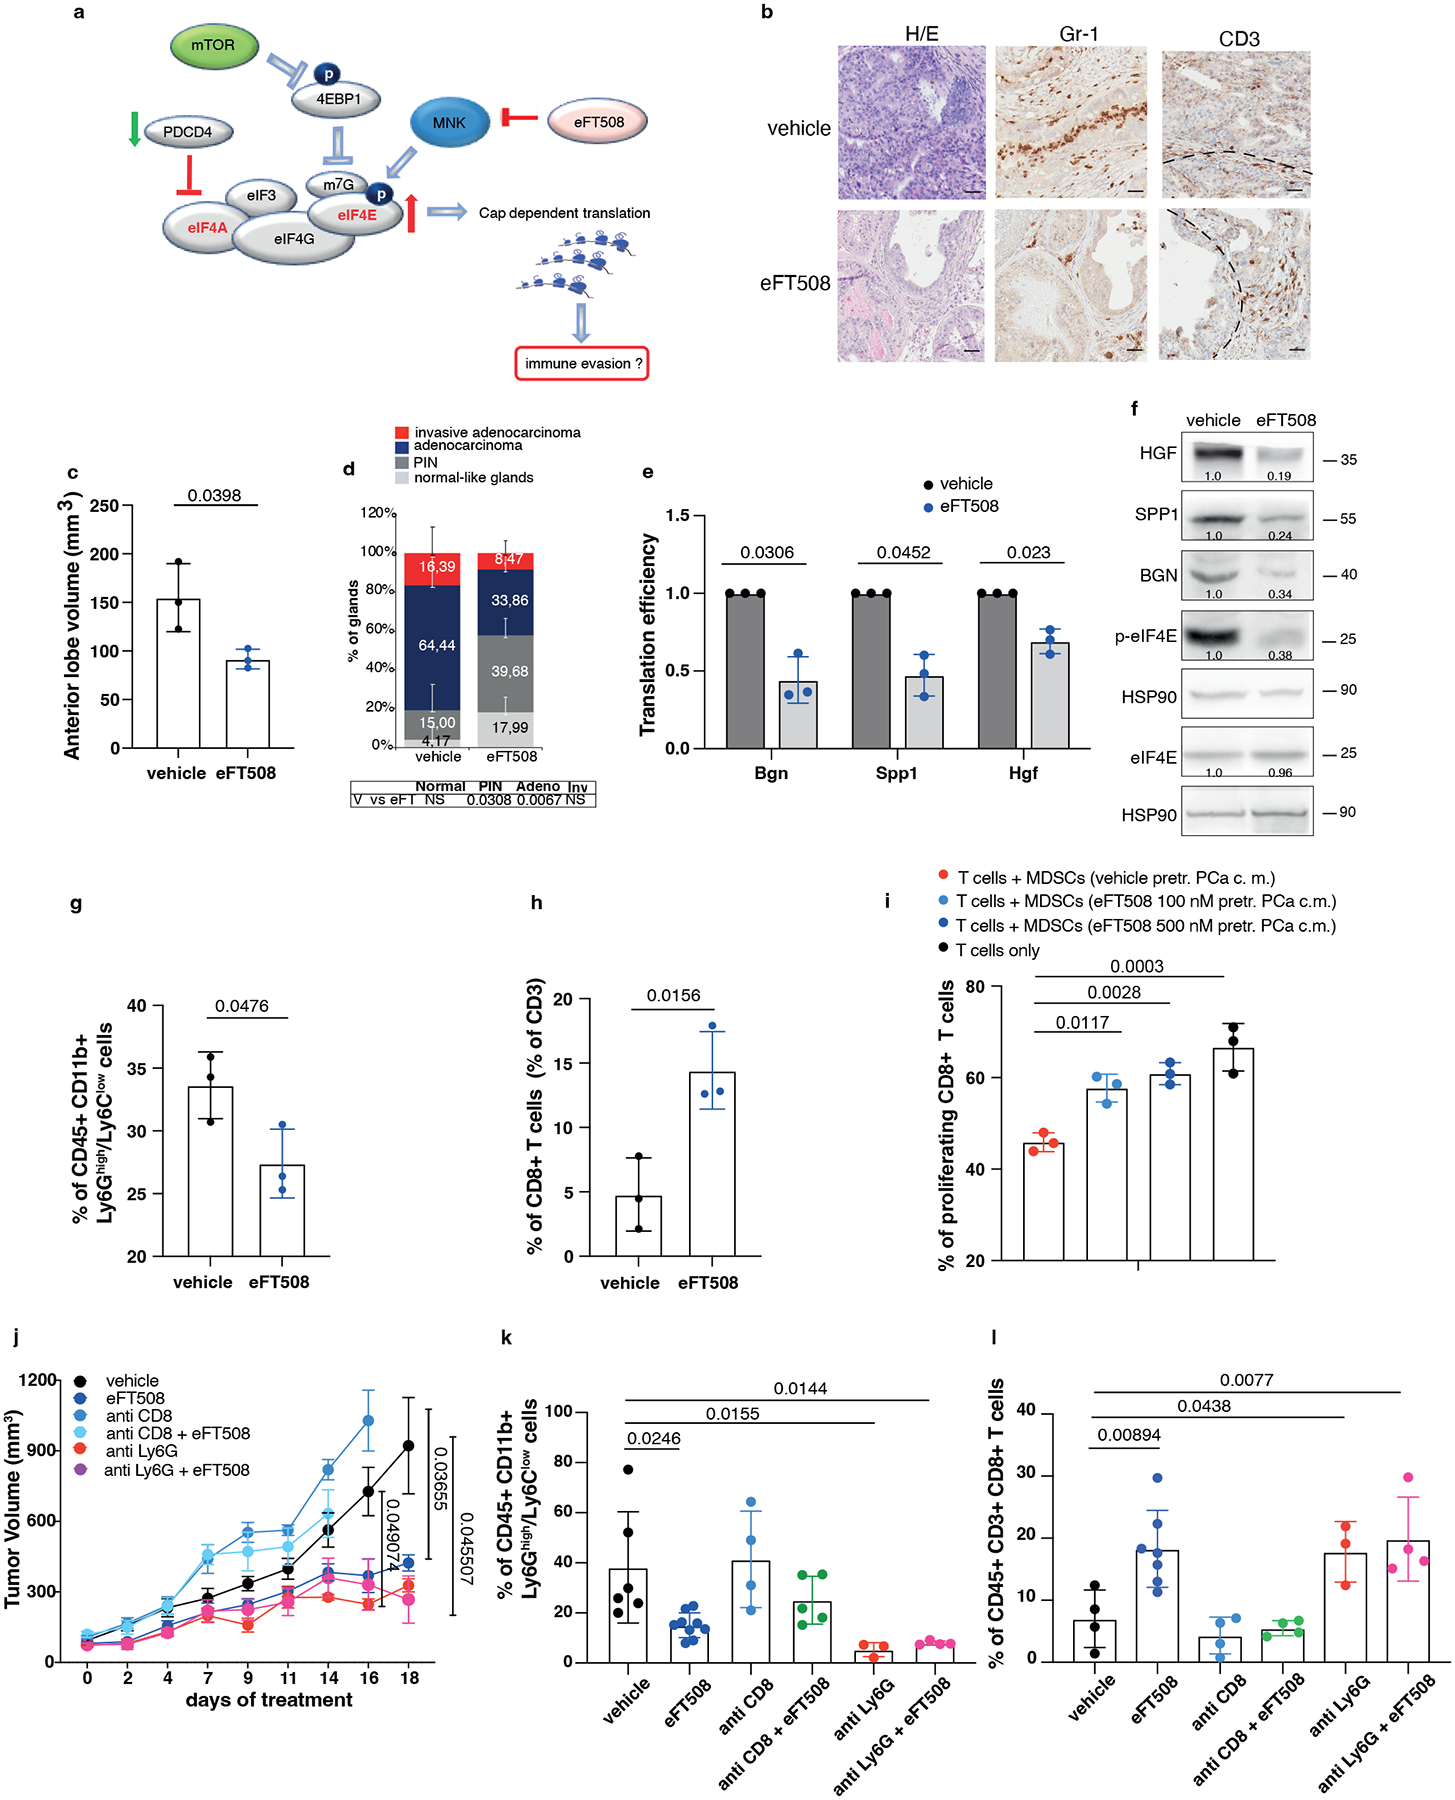
a, Model depicting the proposed mechanism by which MNK1/2 inhibition by eFT508 may inhibit translation and modulate the tumor microenvironment. b, Representative H/E, Gr-1 and CD3 staining (n = 3 mice in each group). Scale Bar 50 μm. c, Volume of the anterior prostate glands (n = 3 mice in each group). d, Histopathological score (n = 3 mice in each group). Summary table with statistical analysis (bottom) (2-way ANOVA followed by Šídák’s multiple comparisons test; top). PIN, prostatic intraepithelial neoplasia. e, Translation efficiency (polysomal mRNA expression/total mRNA expression) of Bgn, Spp1 and Hgf in eFT508-treated and vehicle-treated prostate cancer. n = 3 prostate tumors for each group. Statistical analysis (two-tailed ratio paired t test). f, Western blot analysis showing the protein levels of HGF, SPP1, BGN, p-eIF4E, eIF4E and representative HSP90 in eFT508-treated and vehicle-treated prostate cancer. Densitometry values normalized to the respective loading control are indicated for each band. The experiment was repeated three independent times with similar results. g, Percentage of CD45+/CD11b+/Ly6Ghigh/Ly6Clow cells (PMN-MDSCs) inside the CD45+ population (n = 3 mice in each group). h, Percentage of CD45+/CD3+/CD8+ cells inside the CD45+ population (n = 3 mice in each group). i, Flow cytometric analysis of CFSE dilution in spleen-derived T cells co-cultured with bone marrow-derived MDSCs in a T cell suppression assay; MDSCs were incubated for 24 hours with c.m. of eFT508-treated prostate cancer cells. n = 3 biological replicates. The experiment was repeated two independent times with similar results. j, Tumor growth of RapidCap allografts in C57BL6 mice treated with eFT508 (20 mg/Kg) or the indicated depleting-antibodies: anti-Ly6G (150 μg/Kg) and anti-CD8 (200 μg/Kg) (from the top of the legend, n = 8, n = 9, n = 4, n = 5, n = 5, n = 5). Data are mean ± SEM. Statistical analysis between all groups and time points (multiple unpaired t test). k, Percentage of CD45+/CD11b+/Ly6Ghigh/Ly6Clow cells (PMN-MDSCs) inside the CD45+ population (from the left, n = 6, n = 9, n = 4, n = 5, n = 3, n = 4). l, Percentage of CD45+/CD3+/CD8+ cells inside the CD45+ population (from the left, n = 4, n = 7, n = 4, n = 4, n = 3, n = 4). Data are mean ± SD in (c-e, g-i, k-l). Statistical analysis (two-sided unpaired Student’s t-test) in (c) and (g-h). Statistical analysis between all groups (ordinary one-way ANOVA followed by Tukey’s multiple comparisons test) in (k) and (i) and one-way ANOVA followed by Dunnett’s multiple comparisons test in (l).