
Fig. 6. Dual eFT508 and ipatasertib treatment dampens tumor-growth, tumor-infiltrating PMN--MDSCs and increases CD8+ T cells in Ptenpc−/− Trp53pc−/− prostate cancer.
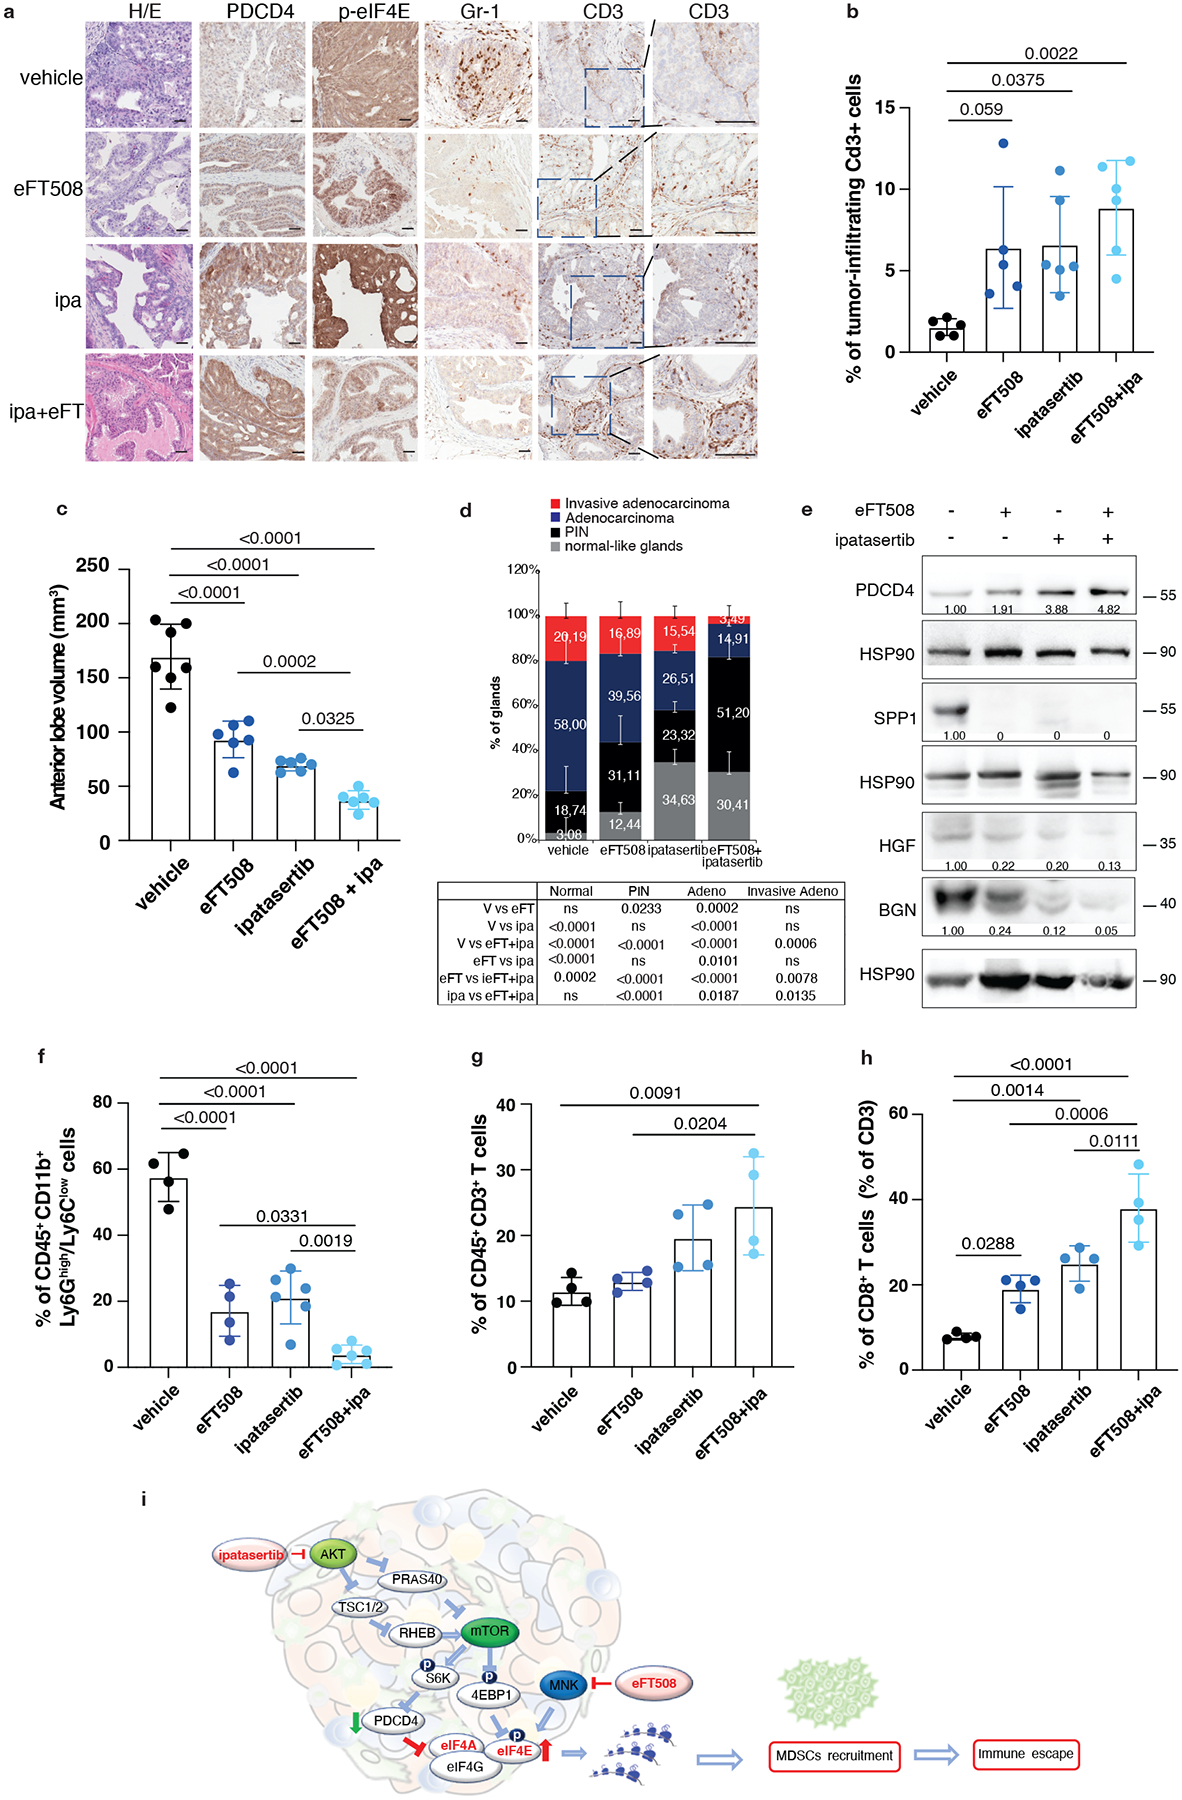
a, Representative haematoxylin and eosin (H/E), PDCD4, p-eIF4E, Gr-1 and CD3 staining in the tumor at the completion of the study. (vehicle n = 5, eFT508 n = 5, ipa n = 6, eFT+ipa n = 6). Scale bar 50 μm. b, Quantification of the percentage of CD3+ cells infiltrating the glands in the tumors of the indicated treatment groups (from the left, n = 5, n = 5, n = 6, n = 6). c, Volume of the anterior prostate glands in Ptenpc−/−;Trp53pc−/− mice randomly assigned to the indicated treatment groups (from the left, n = 7, n = 6, n = 6, n = 6). d, Histopathological score of Ptenpc−/−;Trp53pc−/− prostate tumor glands in the indicated treatment groups (from the left, n = 5, n = 5, n = 6, n = 6). Summary table with statistical analysis (2-way ANOVA followed by Tukey’s multiple comparisons test) on the bottom. e, Western blot analysis showing the protein levels of PDCD4, HGF, SPP1 and BGN in Ptenpc−/−;Trp53pc−/− whole tumor lysates in the indicated treatment groups. Densitometry values normalized to the respective loading control are indicated for each band. The experiment was repeated two independent times with similar results. f, Percentage of CD45+/CD11b+/Ly6Ghigh/Ly6Clow cells (PMN-MDSCs) inside the CD45+ population in Ptenpc−/−;Trp53pc−/− prostate cancer (from the left, n = 4, n = 4, n = 6, n = 6). g, Percentage of CD45+/CD3+ cells inside the CD45+ population in Ptenpc−/−;Trp53pc−/− prostate cancer (n = 4 in each group). h, Percentage of CD45+/CD3+/CD8+ T cells (% of CD3+ T cells) inside the CD45+ population determined by flow cytometric analysis in Ptenpc−/−; Trp53pc−/− prostate cancer in the indicated treatment groups (n = 4 in each group). i, Model depicting the proposed mechanism by which ipatasertib and eFT508 inhibit protein synthesis of the immunosuppressive secretome. Data are mean ± SD. Statistical analysis in b,c,f,g,h between all groups: (ordinary one-way ANOVA followed by Tukey’s multiple comparisons test).