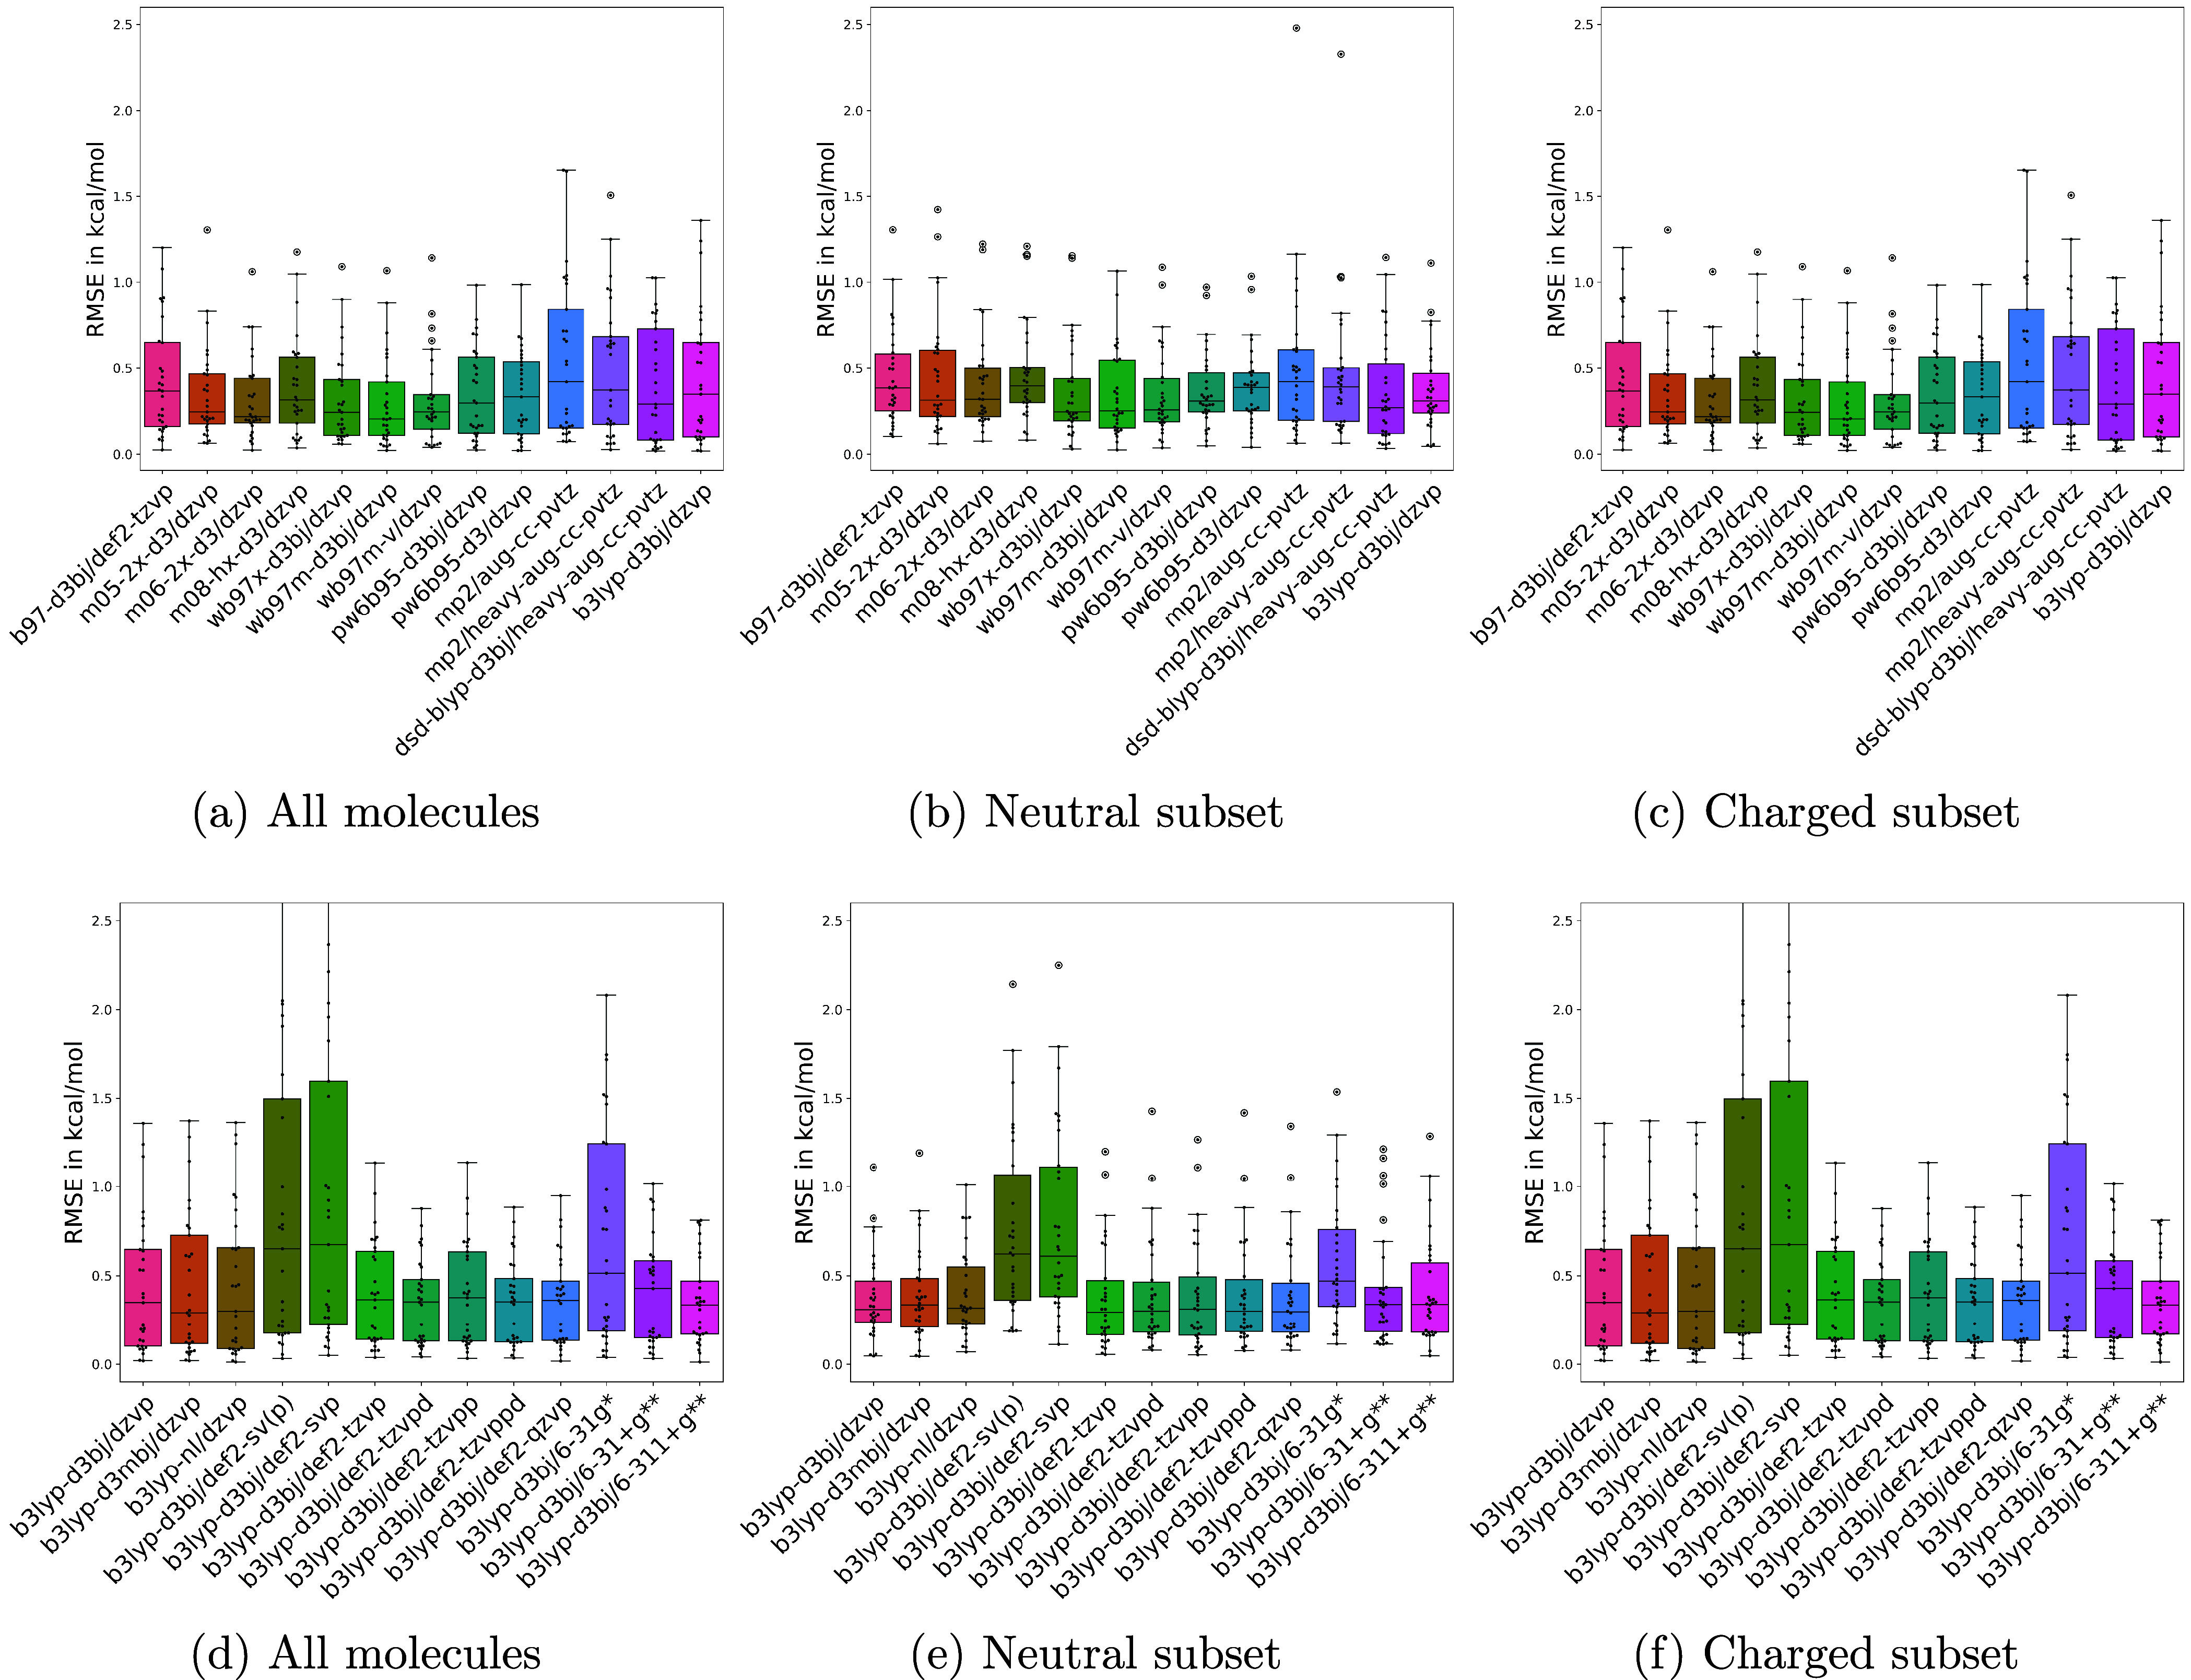
Figure 3.

RMSE on the entire benchmark data set and on subsets of neutral and charged molecules. The top row shows the RMSE in torsion profile energies with different functional and basis set combinations. The bottom row shows the RMSE within the B3LYP functional.
