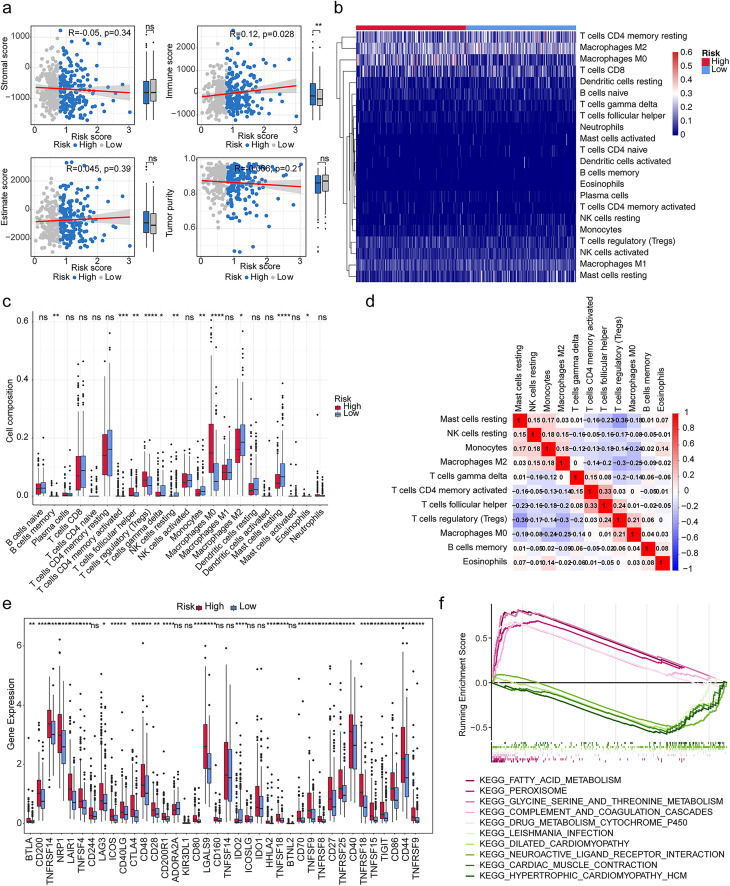
Figure 4.
Immune infiltration analysis and enrichment analysis. (a) Comparison of stromal score, immune score, estimate score, and tumor purity between high- and low-risk groups. ns, not significant; *p < 0.05; **p < 0.01. (b) The heat map of immune infiltrating cells in HCC patients. (c) The discrepancies of the cell composition of immune cells in high and low-risk groups. ns, not significant; *p < 0.05; **p < 0.01; ***p < 0.001; ****p < 0.0001. (d) The correlation analysis among differential immune cells. (e) The expression of 48 immune checkpoints was compared between high-risk and low-risk groups. ns, not significant; *p < 0.05; **p < 0.01; ***p < 0.001; ****p < 0.0001. (f) Enrichment of multiple signaling pathways involved in differential genes between high and low risk groups.

