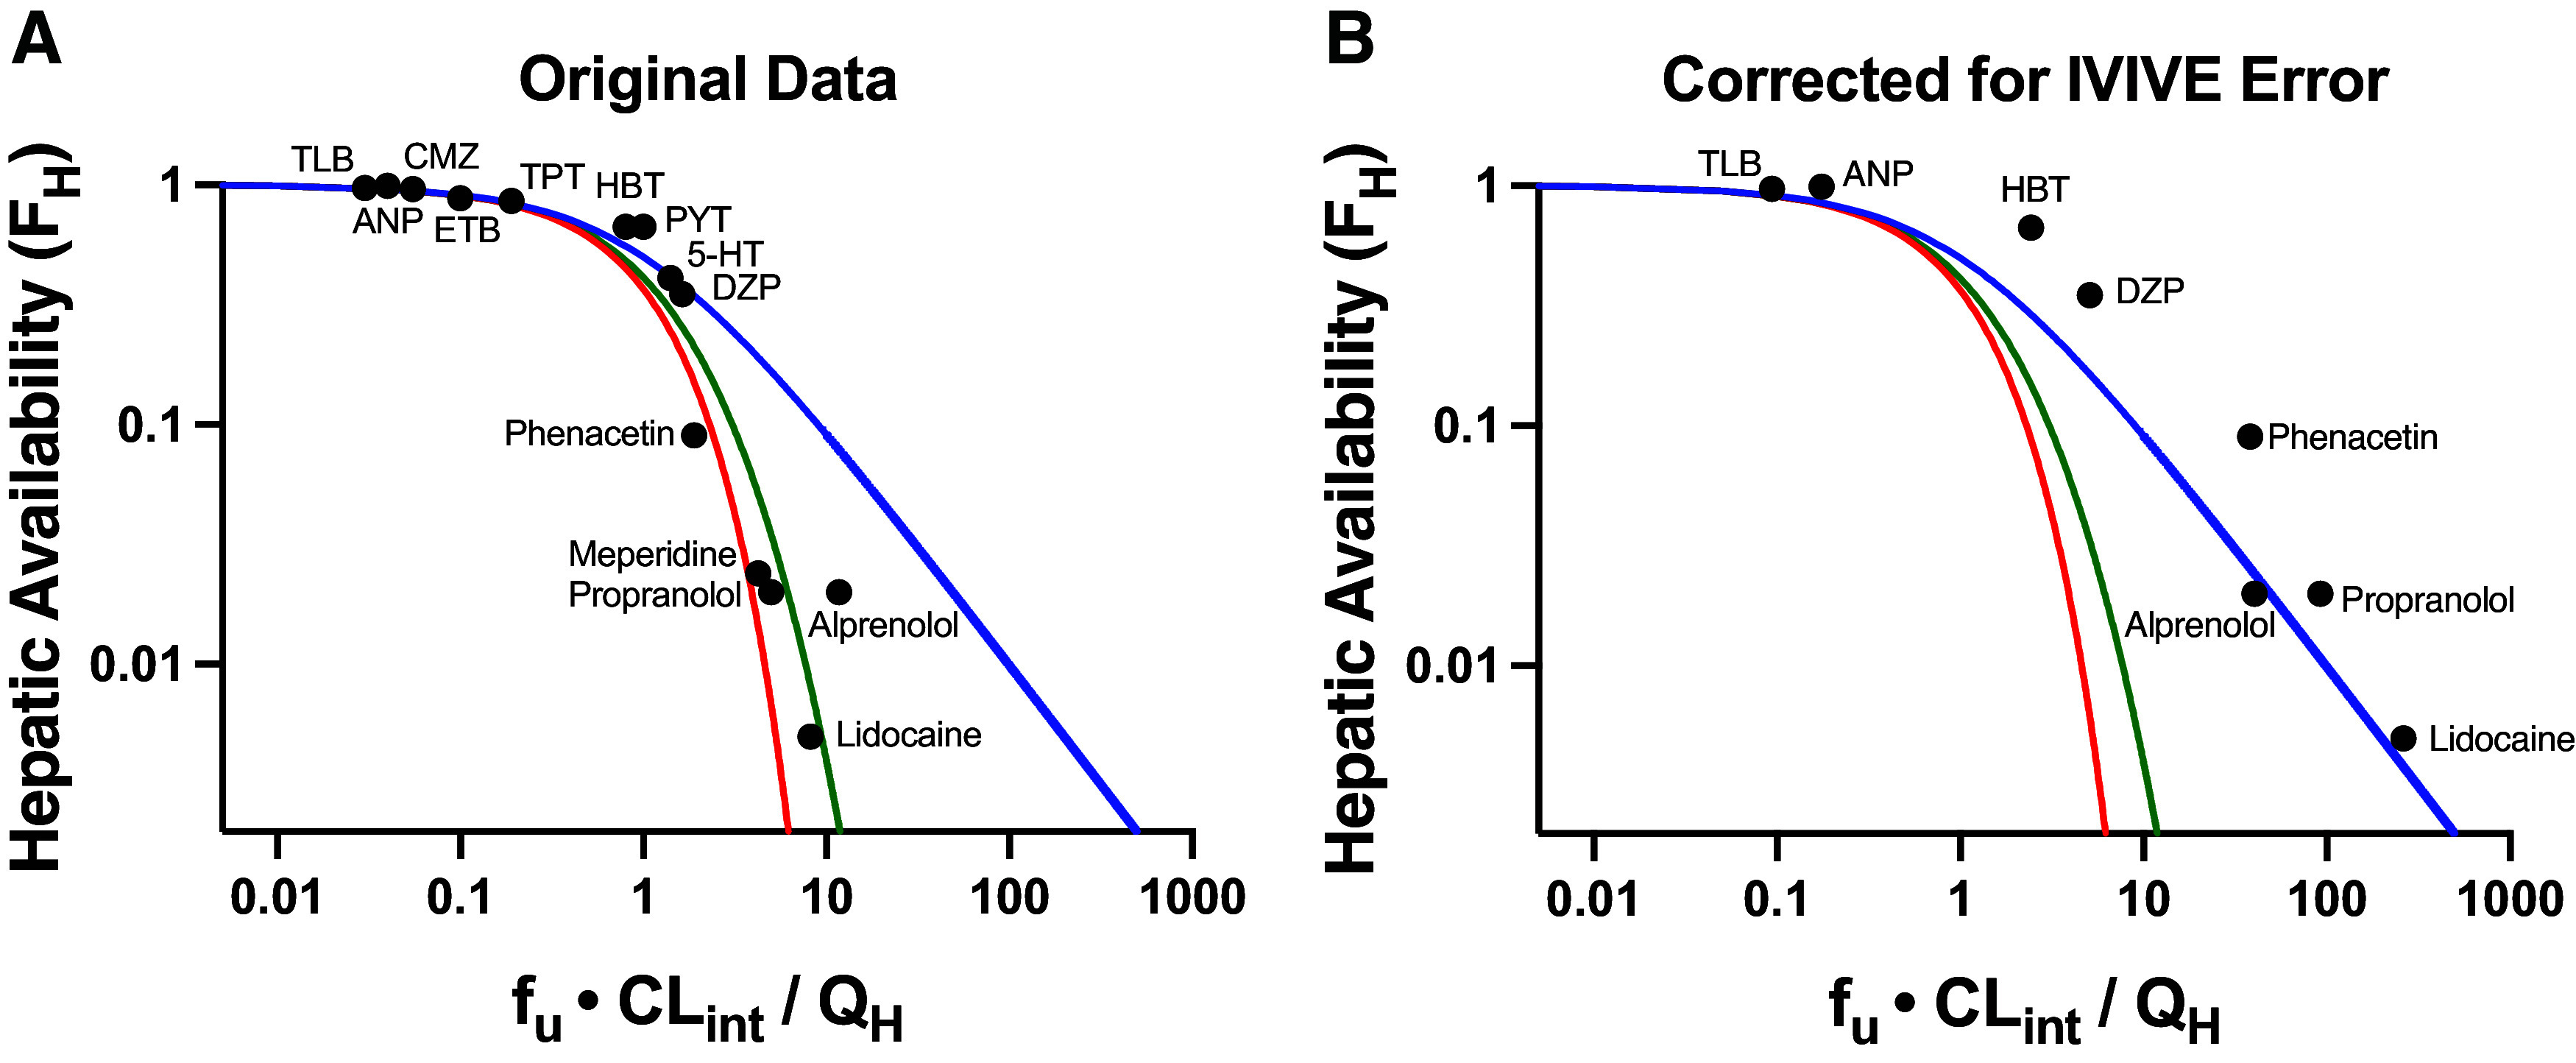
Fig. 1.

Plots of hepatic availability (FH) vs. efficiency number (fu·CLint/QH) based on (A) originally published analysis, and (B) further corrected for in vitro-in vivo underprediction error. The theoretical clearance relationships are represented with lines in blue (the eq. 4 relationship; previously regarded as WSM), red (parallel tube model), and green (dispersion model). (A) Data points assuming no error in IVIVE prediction are depicted, based on original analysis from Roberts and Rowland (1986) and Iwatsubo et al. (1996). (B) Original data are corrected for degree of observed IVIVE underprediction error, based on human liver microsomal IVIVE data reported by Wood et al. (2017) in the Supplemental Data of that paper. The five high extraction ratio compounds included in this analysis (alprenolol, lidocaine, meperidine, phenacetin and propranolol) are labeled. Additional compounds (low and moderate extraction ratio) are labeled with the following abbreviations: 5-HT, 5-hydroxytryptamine; ANP, antipyrine; CMZ, carbamazepine; DZP, diazepam; ETB, ethoxybenzamide; HBT, hexobarbitone; PYT, phenytoin; TLB, tolbutamide; TPT, thiopental.
