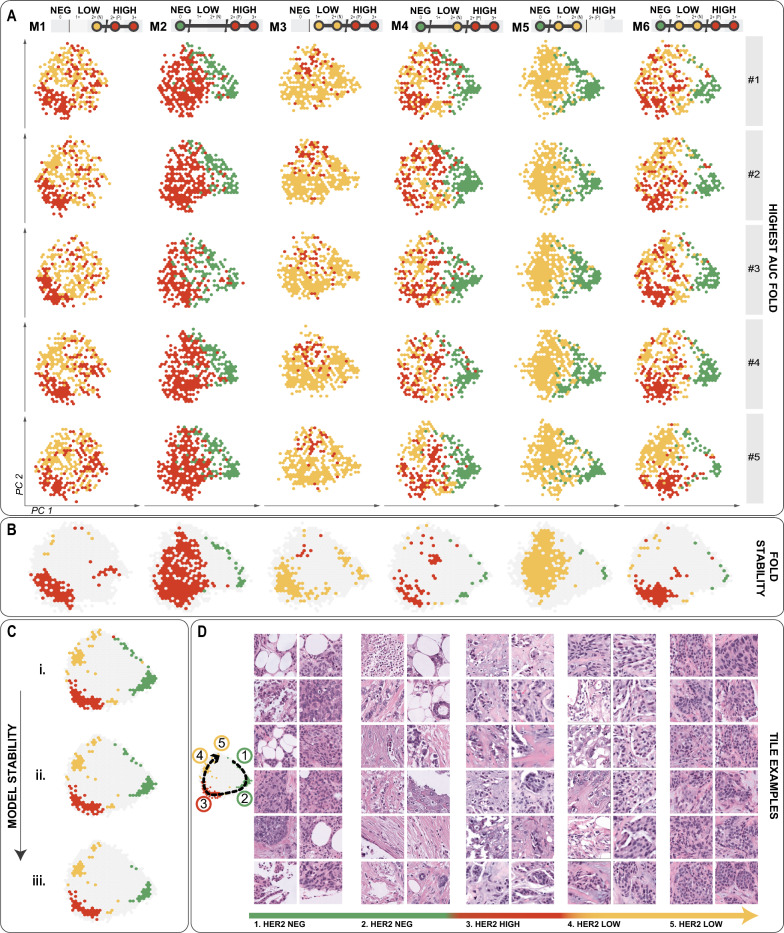
Fig. 4.
Model explicability analysis. A Tile embedding is plotted using the PCA results for each model and fold, only coloring regions according to the HER2 group classification that relies on attention to that embedding. B Colored bins indicate features used by 50% of the folds within each model. C The consistency of the models highlights how many models use the same embedding for classifying each HER2 group. There are three levels of agreement: i. 2 or more; ii. 3 or more; iii. 4 or more. D Examples of tiles from the embedding space for each class

