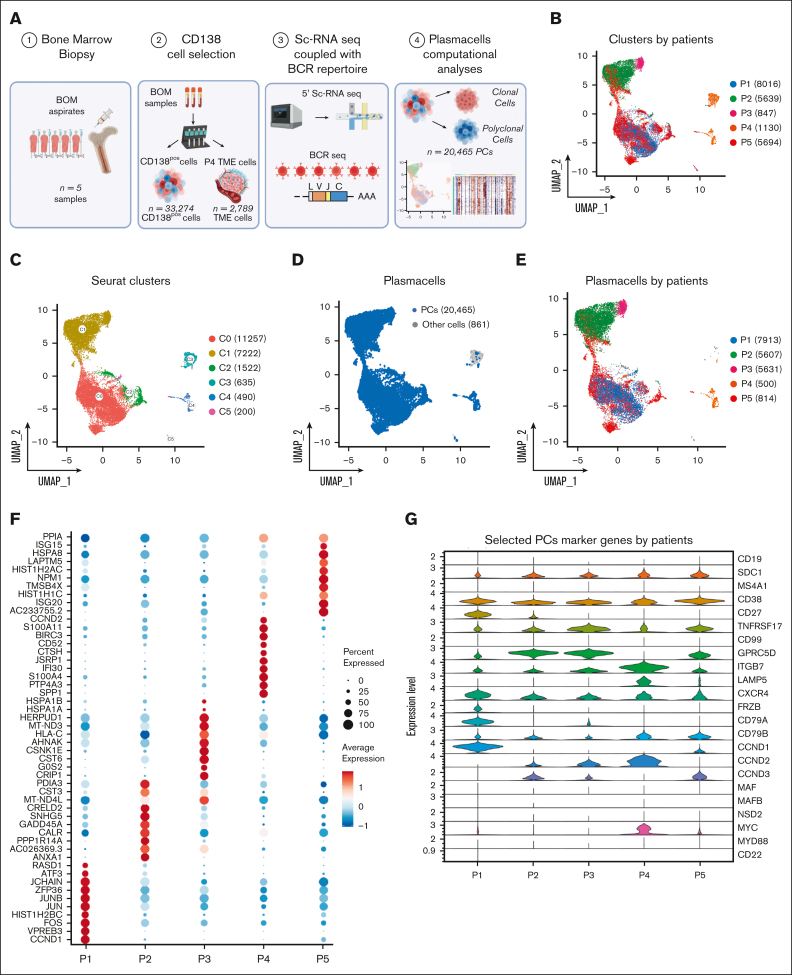
Figure 1.
The landscape of SMM and MM PCs at single-cell resolution. (A) Overview of cohort of SMM and MM patients and experimental setup of the study, including CD138 sorting of PCs, 5' scRNA-seq coupled with BCR profiling and bioinformatic pipelines. (B-C) UMAP representation of analyzed cells by patients and by Seurat clusters. (D-E) Selection of PCs after cell assignment (D) and clustering of PCs by patients (E). (F) Dot plot of top 10 marker genes by patients. (G) Violin plot showing the normalized expression levels of 23 representative selected marker genes across the 5 patients.

