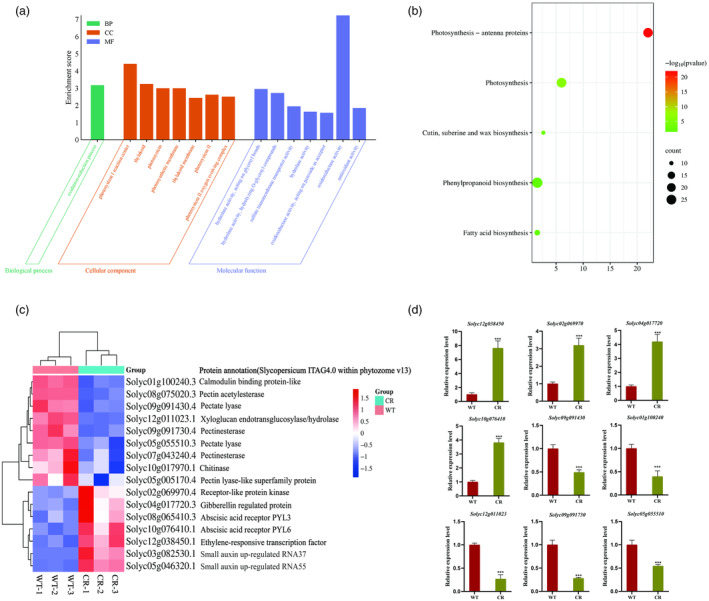
Figure 7.

Transcriptome sequencing analysis of wild‐type (WT) and CR fruits at 39dpa. (a) Gene Ontology (GO) pathway annotation classification of differentially expressed genes (DEGs). The x‐coordinate represents the GO Term, and the y‐coordinate shows the GO Term enriched −log10 (P‐value), DEGs were selected with a value of | log2 (FoldChange) | >1 and P adj < 0.05, as indicated below. (b) Kyoto Encyclopedia of Genes and Genomes (KEGG) functional enrichment of differentially expressed genes. The horizontal coordinate represents the rich factor, and the vertical coordinate represents the pathway. The size of the dots in the figure corresponds to the number of differentially annotated genes in the corresponding pathway, and the depth of colours represents the significance level. (c) Clustering heatmap of DEGs related to pectinase and ethylene regulatory pathways. Genes are represented horizontally, with one sample for each column. Red indicates high expression, and blue indicates low expression. (d) The expression levels of pectinases genes, ethylene and GA regulatory pathway‐related genes in WT and CR lines. Values are presented as means ± SD (n = 3). Asterisks indicate the significant difference between wild‐type and transgenic plants revealed by t‐test: *P < 0.05, **P < 0.01, ***P < 0.001.
