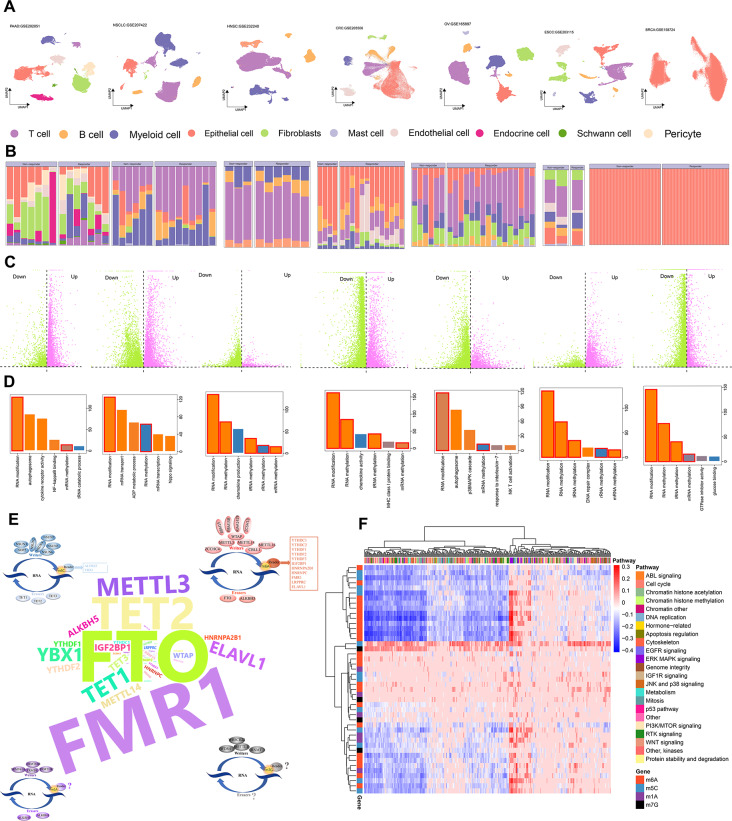
Fig. 2.
Differences between treatment responders and non-responders are associated with RMRs. (A) UMAP plot displaying diverse cell types that have been identified. (B) Bar plot showing the percentage of different cell subpopulations in treatment responders and non-responders. (C) Volcano illustrating different expression genes between responders and non-responders. (D) Demonstrating pathways for differential gene enrichment with P < 0.05. (E) 46 RNA methylation regulators classified as writers, readers, and erasers from m6A, m5C, m1A, and m7G. (F) Heatmap displaying the correlation between RMRs expression and drug IC50 values of the GDSC database

