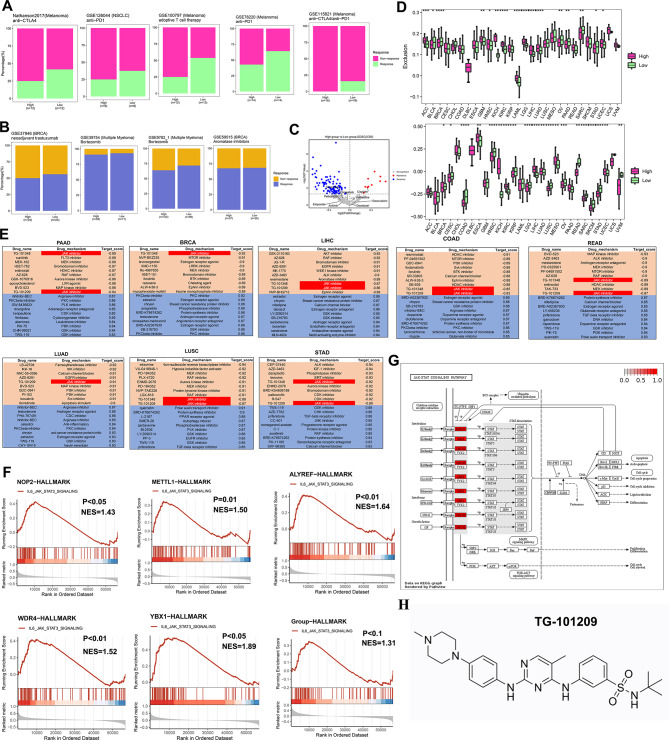
Fig. 7.
The therapy response of RMRs to drugs. A. The fraction of patients with clinical response to immunotherapy. B. The fraction of patients with clinical response to chemotherapy. The difference was tested by the chi-square test. C. Volcano plot showing drugs that were differentially sensitive in the two groups. D. Boxplot revealing dysfunction and exclusion scores in different groups by TIDE methods, in which a higher score means ineffective immunotherapy. E. Correlation of RMRs expression with drugs. The table shows the top 10 positively and negatively correlated compounds from the connectivity map. The target score ranged from − 1 (negative connectivity) to + 1 (positive connectivity). F. GSEA of RMRs in various cancer types. The enrichment score > 0 demonstrated the positive correlation between RMRs expression and the activity of Hallmark pathways. G. Demonstration of JAK-STAT signaling pathways upstream and downstream genes. H. Chemical structural formula of JAK inhibitor TG-101,209

