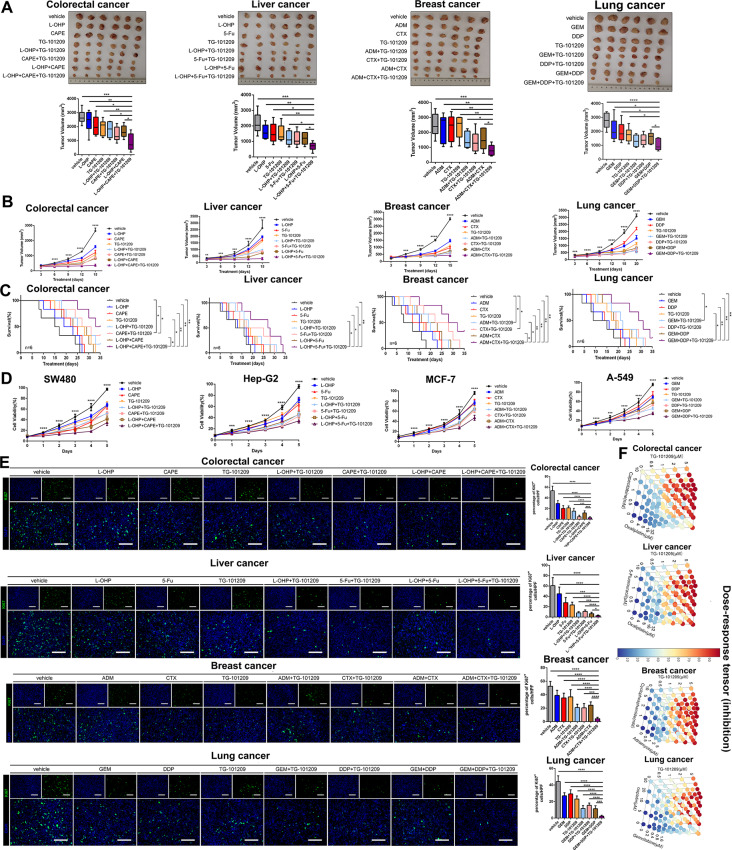
Fig. 9.
TG-101,209 increased tumor response to chemotherapeutic agents. (A) Subcutaneous growth of mice in the control group, single-drug, two-drug combination, and TG-101,209 in combination with two traditional drugs groups (n = 6). (B) The volume change of nude mice implanted tumors was recorded every 3 days. Each bar represents the mean ± SD for six animal measurements. (C) The K-M survival analysis in different chemotherapy drug treatment groups was performed until the sacrifice of mice. Tumor cell lines were transplanted to the liver in situ of mice. (D) CCK-8 assay was performed to determine the cell viability after treatment in MCF-7, A-549, SW480, and Hep-G2 cell lines. (E) Representative ki67 and 4-6‐Diamidino‐2‐phenylindole (DAPI) immunofluorescence staining of tumor sections from the tumor tissues in different treatment groups. (F) Three-dimensional stereo thermograms showing synergistic promotion between two-by-two drugs. * P < 0.05, **P < 0.01 or *** P < 0.001

