. 2024 Aug 17;11(2):e001243. doi: 10.1136/lupus-2024-001243

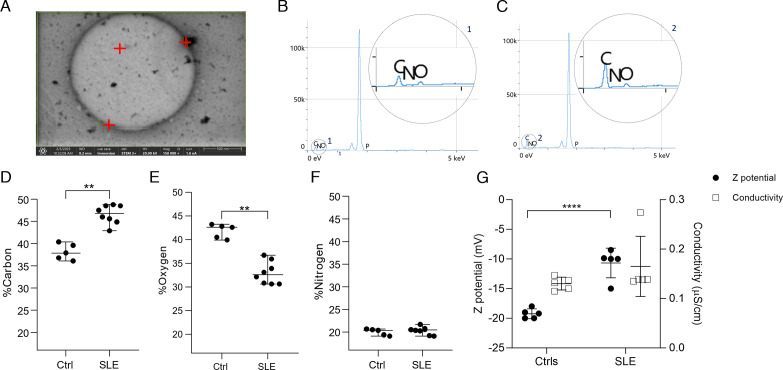
Figure 2. Extracellular Vesicles (EVs) from patients present a different energy dispersion spectrum and are less electronegative than controls. Chemical characteristics of SLE-EVs and Ctrl-EVs by Energy Dispersive X-ray Spectroscopy (EDXS) and surface charge by Dynamic Light Scattering (DLS) evaluation. (A) Representative microphotograph of an EV at 150.000X magnification. Red marks indicate the points where EDXS analysis was performed. (B, C) Representative EDXS spectrum. Details 1 and 2 show the peaks for carbon, oxygen and nitrogen atoms in a control and patient sample, respectively. Two EVs per sample were evaluated and two or three points were analysed per EV; then, the mean of the lectures obtained per point was plotted. (D–F) Dot plots show the distribution (%) between carbon, oxygen and nitrogen atoms in each EV and the means of SLE-EV (n=3) and Ctrl-EV (n=3) individual measurements. (G) Charge surface of SLE-EVs (n=5) and Ctrl-EVs (n=5). SLE and control samples were analysed by DLS to obtain electrokinetic potential. The conductivity value was given by the instrument before the analysis to guarantee proper results. Each sample was analysed twice. T-test: ****p<0.0001. Mann-Whitney test: **p<0.00. Ctrls, controls; SLE, Systemic Lupus Erythematosus.

Figure 2