. 2024 Aug 17;11(2):e001243. doi: 10.1136/lupus-2024-001243

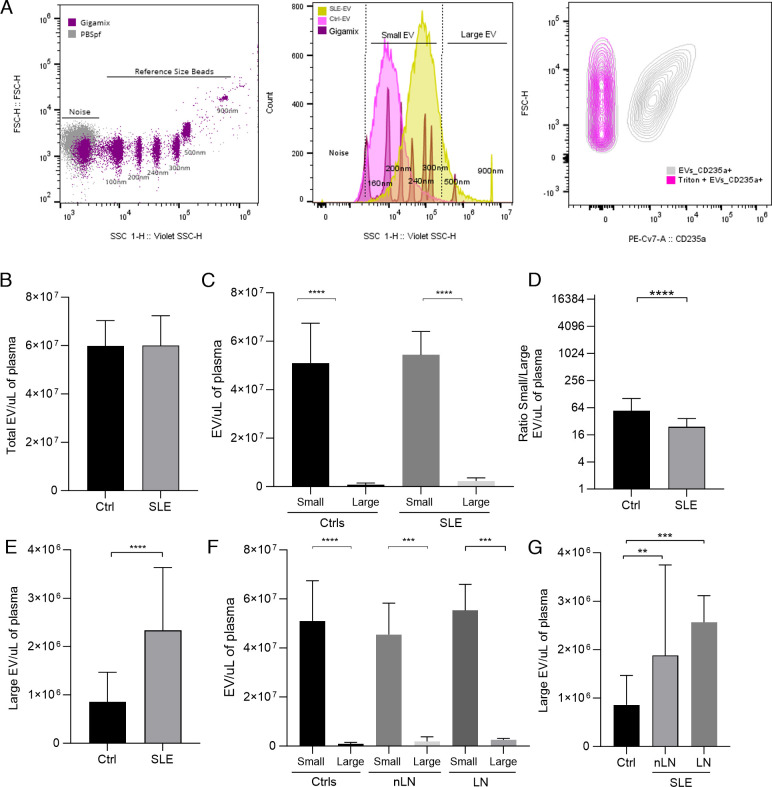
Figure 3. Large Extracellular Vesicles (EVs) are increased in the plasma of patients with SLE and Lupus Nephritis (LN). EVs counts of SLE, LN and control samples by using nano-flow cytometry. (A) The left plot shows the gating strategy used to determine the EV region by using filtered Dulbecco’s phosphate-buffered saline (PBSfp) as background and Gigamix beads (size range 100–900 nm) as size reference region. The middle plot shows the region established for small (100–300 nm) and large EVs (300–900 nm) and representative histograms of a control (pink) and SLE patient (yellow) sample. The right plot shows that EVs are sensitive to detergent treatment. Representative CD235a versus FSC-H contour plot of EVs untreated and treated with 0.05% Triton X-100. CD235a positivity was rapidly altered after Triton X-100 addition. 20 µL of SLE-EVs and Ctrl-EVs were acquired by Cytoflex. (B) Barr diagram shows EVs counts in the total range of the reference beads. (C) Shows the small and large EVs counts by group. (D) Shows the small/large EV ratio and (E) shows the large EV counts for controls and SLE samples. (F) Shows the small and large EV counts by subgroups. (G) Shows the large EV counts for controls and SLE pateints with or without Lupus Nephritis. Ctrls (n=18); SLE (n=35); nLN (n=16); LN (n=19). Mann-Whitney test and Kruskal-Wallis test: **p<0.001, ***p<0.0001, ****p<0.00001. Ctrls, controls; LN, Lupus Nephritis; nLN, without Lupus Nephritis; SLE, Systemic Lupus Erythematosus.

Figure 3