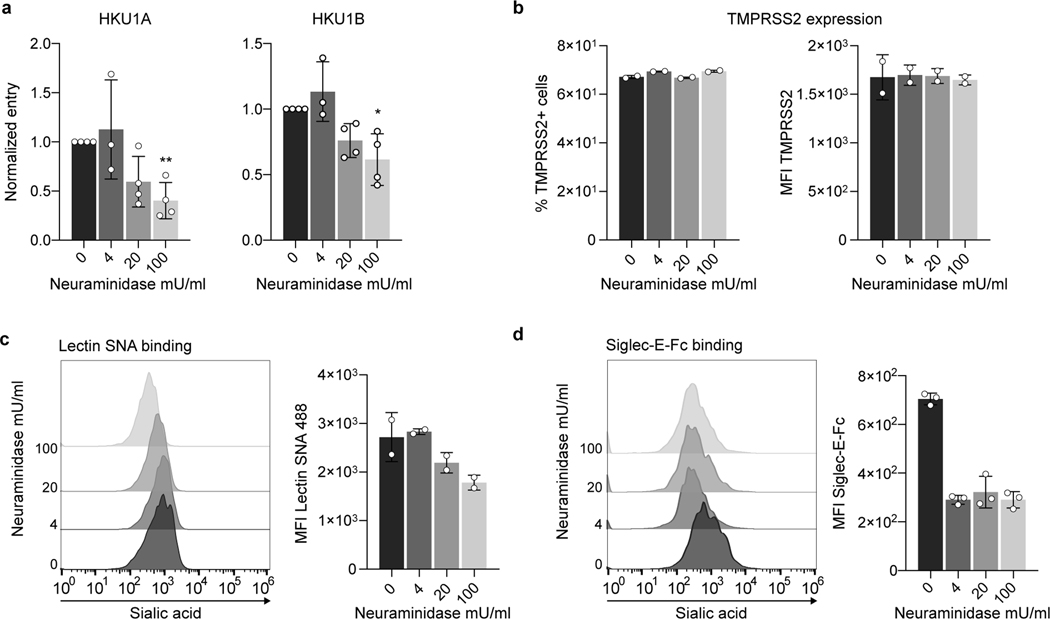
Extended Data Figure 5. Effect of neuraminidase on HKU1 pseudovirus infection.
U2OS-TMPRSS2 cells were treated with indicated concentration of neuraminidase from Arthrobacter ureafaciens for 24 h. a. HKU1A and HKU1B pseudovirus infection in neuraminidase treated cells. Cells were infected with HKU1 A or B pseudoviruses. Luminescence was read 48 h post infection. Data were normalized to the non-treated condition. Data are mean ± SD of 3 (4 mU/mL) or 4 (0, 20, 100 mU/mL) independent experiments. Statistical analysis: Mixed-effect analysis with Geisser-Greenhouse corrections (handles missing values) on non-normalized log transformed data, with Dunnett’s multi-comparison test compared to non-treated cells. b. Surface levels of TMPRSS2 in neuraminidase treated cells. Left: % of TMP positive cells. Right: Median fluorescent intensity (MFI). Data are mean of 2 independent experiments. c. Sambucus Nigra Lectin (SNA) binding on neuraminidase treated cells. Treated cells were stained with fluorescent Lectin SNA which preferentially binds α2,6- over α-2,3 linked sialic acids. Left: Representative histograms. Right: MFI. Data are mean of 2 independent experiments. d. Siglec-E binding on neuraminidase treated cells. Treated cells were stained with recombinant Siglec-E-Fc protein which preferentially binds α2,8- over α2,3- and α2,6-linked sialic acids. Left: Representative histograms. Right: MFI. Data are mean ± SD of 3 independent experiments.

