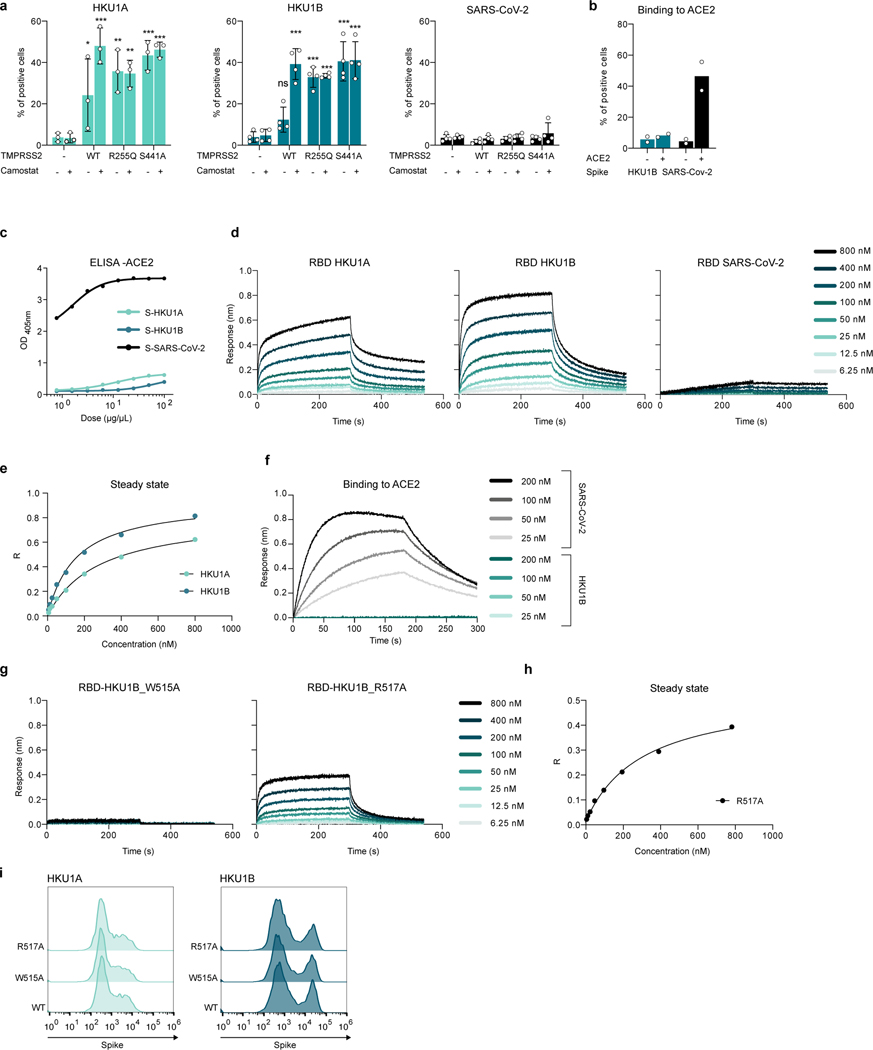
Extended Data Figure 6. Binding of HKU and SARS-CoV-2 spikes to TMPRSS2 or ACE2. a. Binding of the indicated recombinant spikes to 293T cells expressing TMPRSS2.
Cells were transfected with WT or mutant TMPRSS2 and incubated or not overnight with 10 μM of Camostat. The spikes were then incubated for 0.5 h and their binding was revealed with streptavidin-647 and measured by flow cytometry. The % of cells binding to TMPRSS2 was quantified. Data are mean ± SD of 3 (HKU1A) or 4 (HKU1B, SARS-CoV-2) independent experiments. Two Way ANOVA with Dunnett’s multiple comparisons compared to control cells with or without Camostat. Exact p-values: HKU1A: TMPRSS2 WT-: *0.029, TMPRSS2 WT+:***<0.0001, TMPRSS2 R255Q-: **0.0010, TMPRSS2 R255Q+: **0,0013, TMPRSS2 S441A-: ***0,0001, TMPRSS2 S441A+: ***<0.0001. HKU1B: ***<0.0001. b. Binding of the indicated recombinant spikes to 293T cells expressing ACE2. Cells were transfected with ACE2. The spikes were then incubated for 0.5 h and their binding was revealed with streptavidin-647 and measured by flow cytometry. The % of cells binding to ACE2 was quantified. Data are mean of 2 independent experiments. c. Binding of the indicated soluble spikes on immobilized ACE2 measured by ELISA. d. Binding of S441A TMPRSS2 to HKU1A, HKU1B or SARS-CoV-2 RBD measured by BLI. The response was measured at the indicated concentrations of spikes. Left: HKU1A. Middle: HKU1B. Right: SARS-CoV-2. One representative experiment of 4 is shown. e. Determination of the affinity of HKU1A and B RBD for TMPRSS2 using the steady state method. Circles: Experimental values. Black: Fitting of the experimental data f. Binding of ACE2 to SARS-CoV-2 or HKU1B RBD quantified by BLI, at different concentrations of spikes. g. Binding of S441A TMPRSS2 to HKU1B mutants. Response was measured by BLI at different concentrations of spikes. Left: HKU1B RBD mutant W515A. B: HKU1B RBD mutant R517A. h. Determination of the affinity of HKU1B-R517A RBD for TMPRSS2 using the steady state method. Circles: Experimental values. Black: Fitting of the experimental data. i. Cell surface levels of WT and mutant HKU1 spikes. 293T were transfected with the indicated WT or mutant HKU1A or B spikes, expression was measured by flow cytometry after 24 h, using the anti-spike mAb10.

