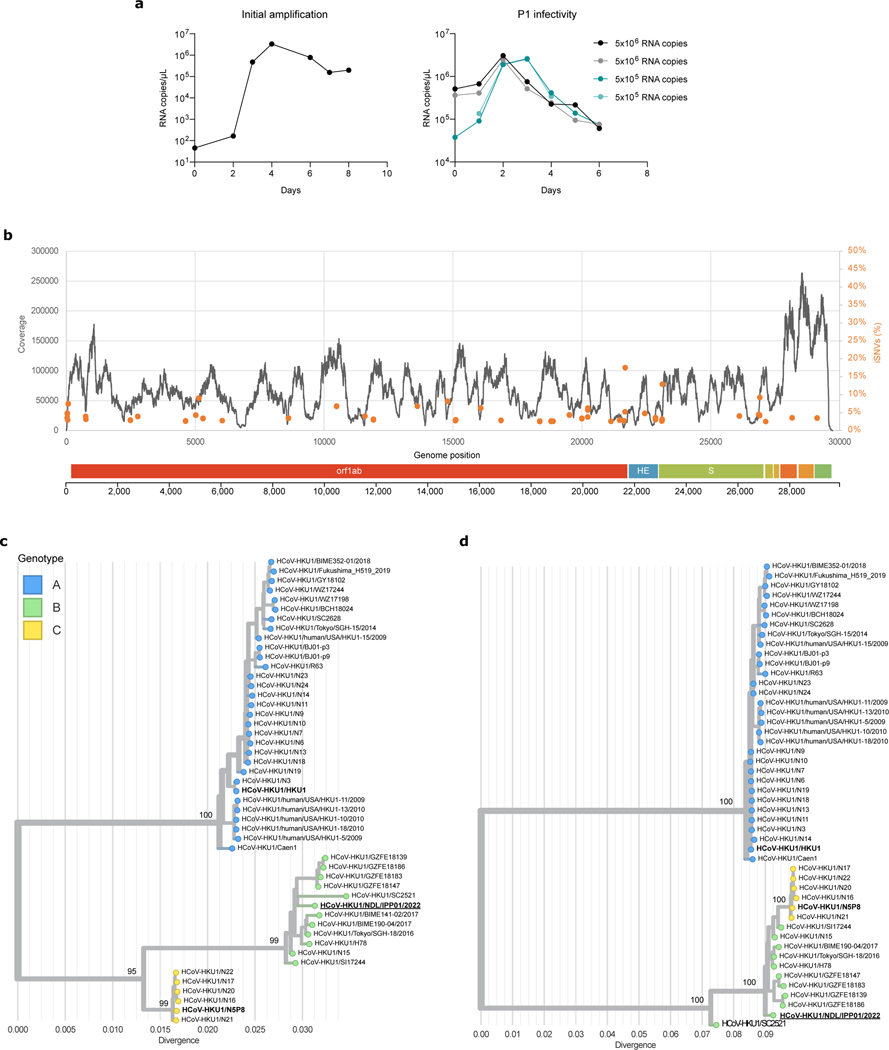
Extended data Figure 8. Isolation and characterization of a live HKU1B virus.
a. Viral RNA copies in the supernatant of HBE cells were quantified by RT-qPCR. The values at day 0 are the content of the input. Left: initial amplification (first passage). Right: Second amplification of the first passage virus (harvested at day 4) used at two dilutions (1/10 and 1/100) in duplicates. b. Reads coverage and frequency of minor variants frequencies of the isolate sequencing data (first passage virus). Intra-sample single-nucleotide variants frequencies were estimated using iVAR69. The genome organization of HKU1 is shown below the plot. c, d. Phylogenetic analysis of HKU1. Maximum likelihood phylogenies of human coronavirus HKU1 (n = 48) estimated using IQ-TREE v2 with 1000 replicates from c. the complete genome and d. spike coding sequences. The tree is midpoint rooted and ultrafast bootstraps values are shown on the main branches. A similar topology was obtained when rooting the tree using another embecovirus (OC43). The tip name corresponding to the newly isolated virus sequence is highlighted in bold and underlined. The tips names corresponding to the recombinant spikes used in this study are shown in bold.

