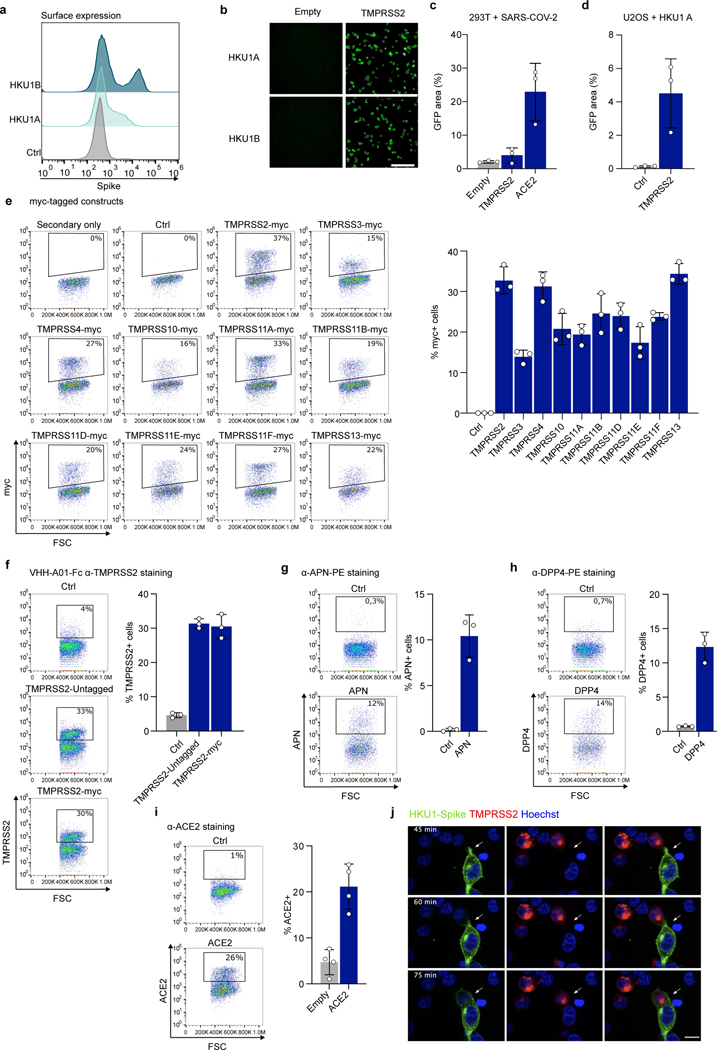
Extended Data Figure 2. Effect of TMPRSS2 and other proteases on HKU1 cell-cell fusion. a, b. Surface expression and fusogenic activity of HKU1 spikes.
a. 293T cells were transfected with plasmids encoding for HKU1A or HKU1B spikes and stained 24 h later with mAb10, a pan anti-coronavirus spike antibody. Data are representative of 3 independent experiments. b. Cell-cell fusion mediated by HKU1A or HKU1B spikes. 293T GFP-Split cells were transfected with HKU1 spikes and TMPRSS2, fusion was visualized by the appearance of GFP+ cells. Data are representative of 6 independent experiments. Scale bar: 400 μm c. Cell-cell fusion mediated by the SARS-CoV-2 spike. 293T GFP-Split cells were transfected with SARS-CoV-2 spike, in the presence of ACE2 or TMPRSS2, fusion was visualized by the appearance of GFP+ cells. Data are mean ± SD of 3 independent experiments d. U2OS cell-cell fusion mediated by HKU1A spike. U2OS GFP-Split cells were transfected with HKU1A spike and TMPRSS2, fusion was visualized by the appearance of GFP+ cells 24 h later. Data are mean ± SD of 3 independent experiments. e. Expression levels of myc-tagged proteases. 293T cells were transfected with a control plasmid or the indicated myc-tagged TMPRSS constructs and stained 24 h later with myc antibody 9E10. Left: Representative dot plots. Right: Percentage of positive cells. Data are mean ± SD of 3 independent experiments. f. Surface expression of tagged and untagged TMPRSS2. 293T cells were transfected with WT TMPRSS2 (TMPRSS2-Untagged) or a myc-tagged TMPRSS2 and surface stained for TMPRSS2 using VHH-A01-Fc. Left: Representative dot plots. Right: Percentage of positive cells. Data are mean ± SD of 3 independent experiments. g, h, i . Surface expression of APN, DPP4 and ACE2. 293T cells were transfected with APN, DPP4 or ACE2 plasmids, and surface stained with the respective antibodies 24 h later. Left: Representative dot plots. Right: Percentage of positive cells. Data are mean ± SD of 3 (TMPRSS2, APN, DPP4) or 4 (ACE2) independent experiments. j. Images of time lapse microscopy of HKU1-mediated cell-cell fusion (extracted from Supp. video 1). 293T cells were transfected either with TMPRSS2-scarlet-I or HKU1A S-NeonGreen. After 24 h, cells were mixed and imaged every 2.5 min for 2 h at 37°C.

