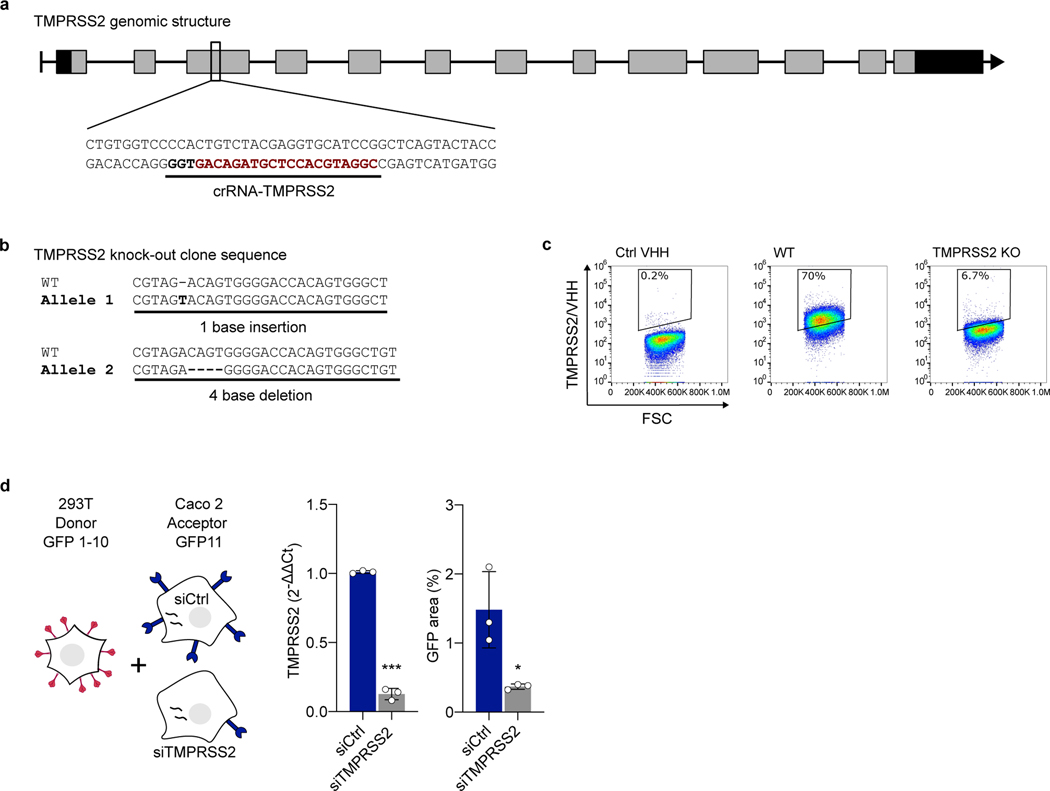
Extended Data Figure 3. Knock-out and silencing of TMPRSS2 in Caco2 cells. a. Linear diagram of the organization of the TMPRSS2 gene.
The CRISPR-Cas9 targeting site is underlined and the proto-spacer recognition motif (PAM) is in bold. Rectangles represent exons, black for 5’ and 3’ untranslated regions, gray for coding regions. b. Sequence analysis of the knock-out Caco2 clone. Both alleles compared to the original wild-type sequence are shown. The knock-out clone harbors an out-of-frame deletion and an insertion, resulting in a frameshift on both alleles. c. Validation of TMPRSS2 knock-out by TMPRSS2 surface staining. Representative dot plots of VHH anti-TMPRSS2 (VHH-A01-Fc) surface staining of a WT and KO Caco2 obtained following CRISPR gene targeting. d. Role of endogenous TMPRSS2 on cell-cell fusion assessed by siRNA. 293T donor cells expressing HKU1A spike were mixed with Caco2 acceptor cells, silenced or not for TMPRSS2. Left: experimental design. Middle: relative expression of TMPRSS2 in Caco2 cells, assessed by RT-qPCR. Data were normalized to β-Tubulin levels. Relative mRNA expression normalized to siCtrl condition (2−ΔΔCT) was plotted. Right: fusion was quantified by measuring the GFP area after 20 h of coculture. Data are mean ± SD of 3 independent experiments. Statistical analysis: two-sided unpaired t-test compared to siCtrl cells. ***p<0.0001.

