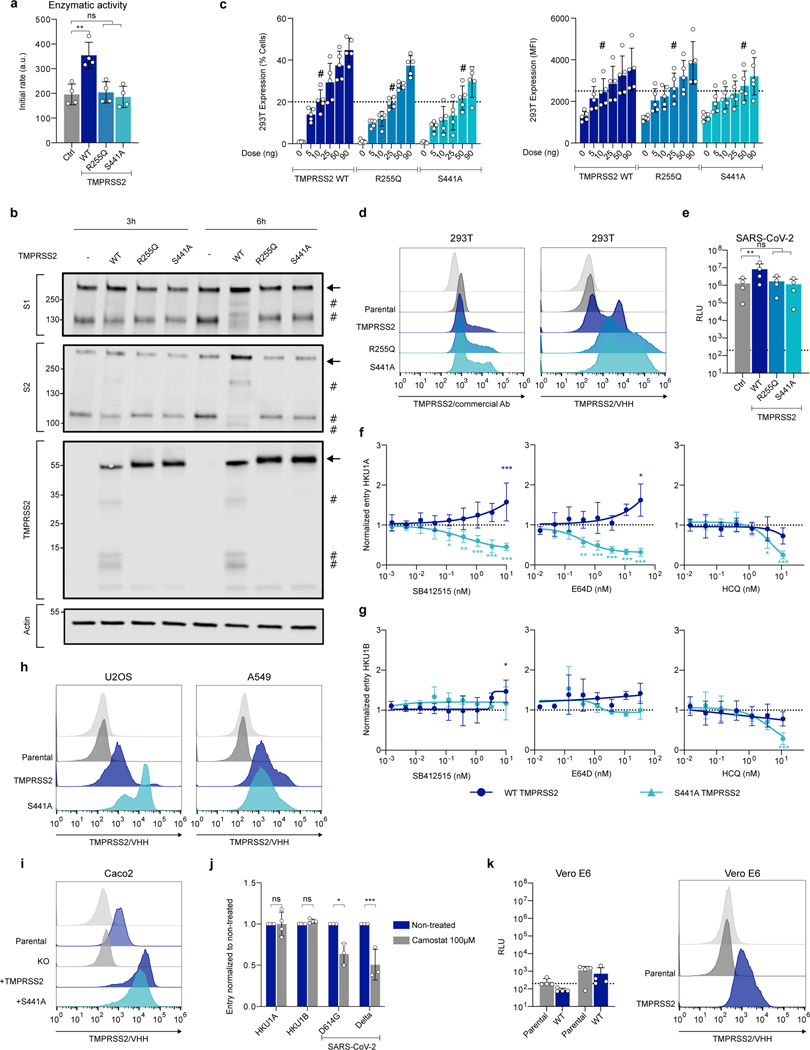
Extended Data Figure 4. Effect of mutant TMPRSS2 on cell-cell fusion and pseudovirus infection a. Enzymatic activity of WT and mutant TMPRSS2.
293T cells were transfected with WT and indicated TMPRSS2 mutants. 24 h post transfection, the catalytic activity was assessed using BoC-QAR-AMC fluorogenic substrate. Data are mean ± SD of 4 independent experiments. Statistical analysis: a: one-way ANOVA with Dunnett’s multiple comparisons compared to Ctrl cells (transfected with pQCXIP-Empty). **p<0.01. b. Effect of TMPRSS2 on HKU1 spike expressed on adjacent cells. 293T cells were transfected either with HKU1A spike or with the different TMPRSS2. 20 h post-transfection, cells were mixed at a 1:1 ratio, and let to settle. 3 or 6 h post-mixing, cells were harvested and lysed for WB. One membrane was probed for S1, TMPRSS2 and actin, another membrane was probed for S2 and actin. For gel source data, see SI 1c, d. Representative blots of 2. Molecular weights: kDa. The arrows and # denote the uncleaved and cleaved protein products, respectively. c. Surface levels of WT and mutant TMPRSS2. 293T cells were transfected with the indicated doses of TMPRSS2 plasmid. 18 h post-transfection they were stained intracellularly for TMPRSS2 using the commercial antibody. Left: % of TMP positive cells. Right: Median fluorescent intensity (MFI). #: indicates the chosen plasmid ratios to achieve similar TMPRSS2 levels with WT and indicated mutants. Data are mean ± SD of 3 independent experiments. d. Comparison of the anti-TMPRSS2 commercial antibody and VHH staining in 293T cells. 293T cells were transfected with WT, R255Q and S441A TMPRSS2 plasmids. Cells were stained 24 h later with the indicated antibodies and analysed by flow cytometry. One experiment representative of 3 is shown. Light grey curves correspond to staining with control antibodies or VHH. Parental: untransfected cells. e. Effect of WT and mutant TMPRSS2 on SARS-CoV-2 pseudovirus infection. 293T cells expressing ACE2 were transfected with WT and indicated TMPRSS2 mutants. 24 h later, cells were infected by Luc-encoding SARS-CoV-2 pseudovirus. Luminescence was measured after 48 h. Data are mean ± SD of 4 independent experiments. Statistical analysis: RM one-way ANOVA with Geisser-Greenouse correction on log-transformed data, with Dunnett’s multiple comparisons compared to Ctrl cells (transfected with pQCXIP-Empty). **p<0.01. f, g. Effect of SB412515, E64d or hydroxychloroquine (HCQ) on f. HKU1A or g. HKU1B pseudovirus infection. 293T cells expressing WT or S441A TMPRSS2 were incubated for 2 h with the indicated drugs, before infection with HKU1A or HKU1B pseudoviruses. Luminescence was read 48 h post infection. Left: SB412515. Middle: E64d. Right: HCQ. Data are mean ± SD of 3 (E64d, HKU1B), 4 (E64d HKU1A, SB142515 HKU1B), 5 (HCQ HKU1A) or 6 (HCQ HKU1B, SB412515 HKU1A) independent experiments. Statistical analysis: RM two-way ANOVA with Geisser-Greenouse correction on non-normalized log transformed data, with Dunnett’s multiple comparisons compared to the non-treated conditions. h, i. Surface levels of TMPRSS2 in different cell lines stably expressing WT or S441 TMPRSS2. Cells were stained for TMPRSS2 using VHH-A01-Fc and analyzed by flow cytometry. Representative histograms are shown. h. Left: U2OS. Right: A549. Light grey: cells stained with a non-target control VHH-Fc. Dark grey: Unmodified parental cell lines. Dark and light blue: Cells transduced with either TMPRSS2 or TMPRSS2 S441A mutant. i. Caco2. Light grey: cells stained with a non-target control VHH-Fc. Blue: Unmodified parental cell line. Dark Grey: TMPRSS2 KO Caco2. Dark and light blue: TMPRSS2 KO caco2 stably transduced with TMPRSS2 WT or S441A mutant expression vectors. j. Effect of Camostat on endogenous TMPRSS2 in Caco2 cells. Caco2 cells were incubated in the presence of 100 μM Camostat for 2 h, before infection with HKU1A, HKU1B, or SARS-CoV-2 (D614G or Delta) pseudovirus. Data are normalized to the infection in the absence of the drug. Data are mean ± SD of 3 (SARS-CoV-2) or 4 (HKU1) independent experiments. Statistical analysis: RM two-way ANOVA on non-normalized log transformed data, with Sidak’s multiple comparisons compared to the non-treated conditions. k. Susceptibility of Vero E6 and Vero E6-TMPRSS2 cells to HKU1 pseudovirus infection. Left: pseudovirus infection. Right: TMPRSS2 surface levels. Dark grey: Parental cells. Dark blue: Cells transduced with TMPRSS2. Data are mean ± SD of 4 independent experiments.

