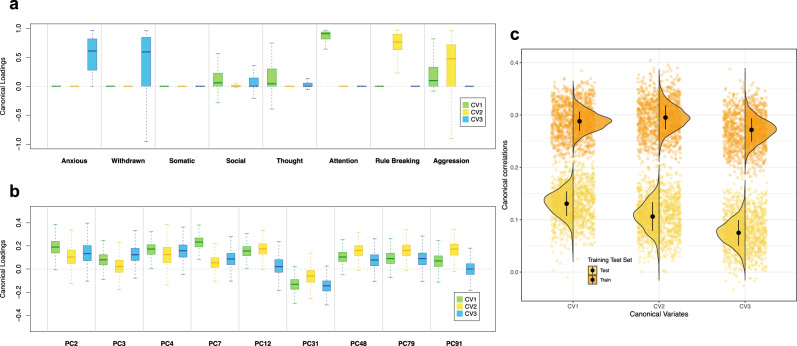
Fig. 4. Stability of canonical correlations and canonical loadings in ABCD (example).
a The variability for the canonical loadings of CBCL syndrome scores across 1000 bootstrap subsamples. The center line is median, the upper quantile is 75% and the lower quantile is 25%. b The variability for the canonical loadings of brain PCs across 1000 bootstrap subsamples. The PCs presented here were selected based on the intersection of top 10 most important PCs for the first three canonical variates. c The variability of the first three canonical correlations in ABCDTraining and ABCDTest set. The black dot is mean, and the vertical black line is standard deviation. Note that the bootstrap subsampling is conducted in one of the 30 train-test splits. CV1: canonical variate 1, CV2: canonical variate 2, CV3: canonical variate 3.

