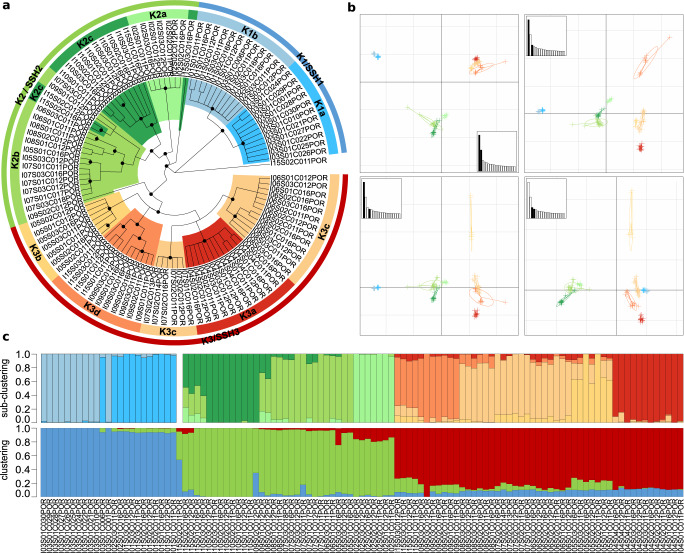
Fig. 3. Genetic delineation of Porites spp.
a SVDquartet tree. Node support ≥80% from 100 bootstraps is indicated with a black dot. Samples are grouped into three main clades (K1-K3) and two, three, and four subclades, respectively (K1a, K1b, K2a, etc.) based on tree morphology and sNMF analysis with the main clades representing the three secondary species hypotheses (SSHs; annotated). b Principal component analysis (PCA) based on genome-wide SNPs. The relative eigenvalues are shown in the subplots with the displayed eigenvectors shaded in black. c Hierarchical genetic clustering using sNMF across all samples with main clades below and subclades above. Bars in each column represent the contribution of predicted ancestral lineages to each sample. Samples are ordered by cluster and then longitudinally by island.

