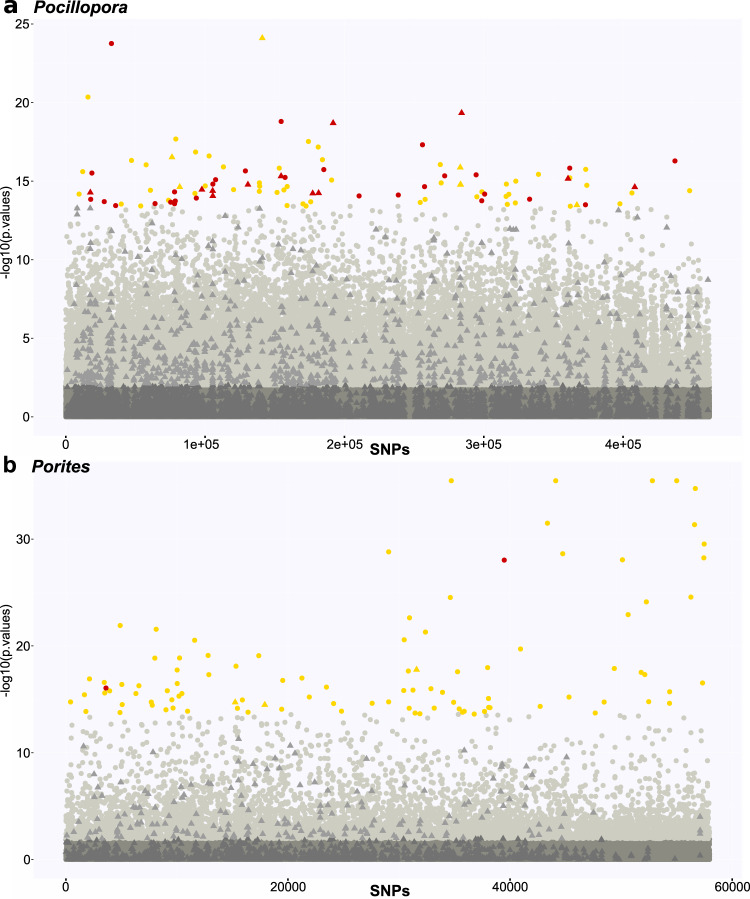
Fig. 6. Manhattan plot displaying the association to past temperature variation of the linkage disequilibrium-filtered genome-wide SNPs computed by RDA analysis.
a Pocillopora, b Porites. The x axis gives cumulative position in the genome with contigs sorted by decreasing size order. P values used to generate the y axis are from the RDA analysis. Circles: SNPs not included in genomic islands of differentiation between SSHs (GID); triangles: SNPs included in GIDs; dark gray: SNPs not significantly associated to past temperature variation; light gray: SNPs significantly associated to temperature variation; gold: top 100 temperature outlier SNPs; red: SNPs among the top 100 temperature outliers under divergent selection among species according to Flink analysis.

