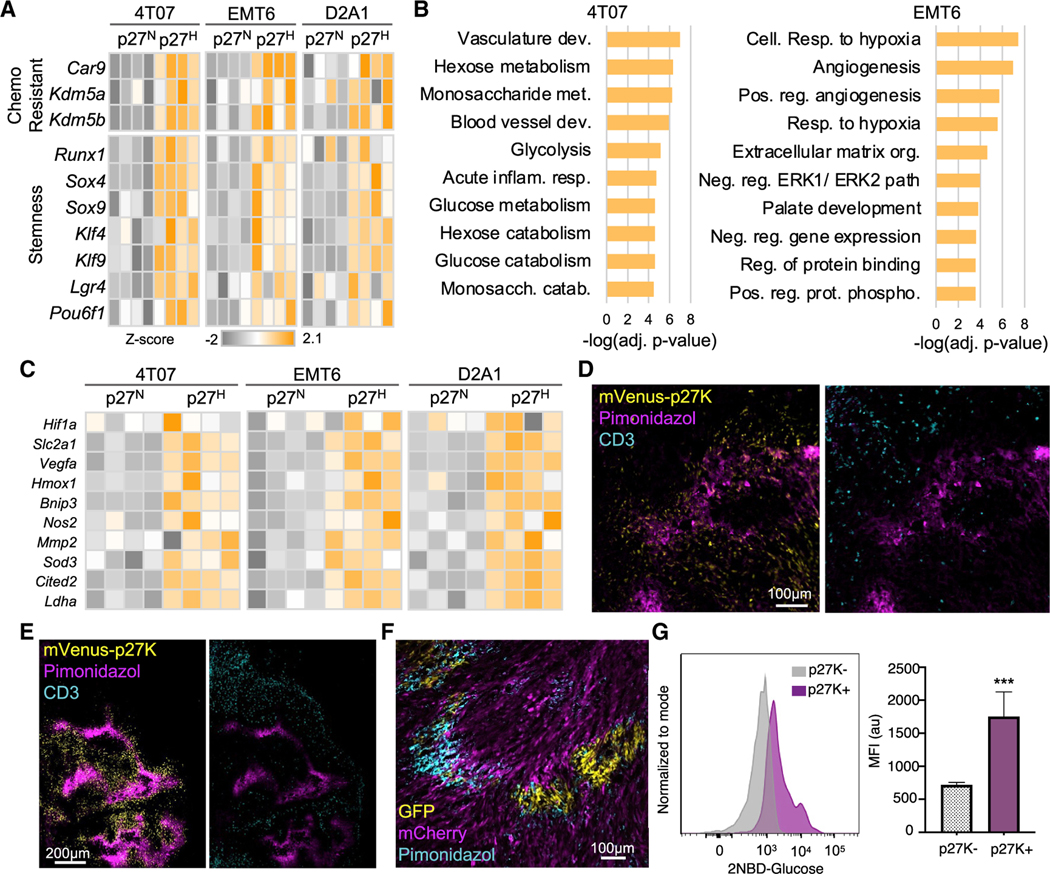
Figure 3. QCCs are hypoxic and glycolytic.
(A) RNA-seq analysis of mCherry+ mVenus-p27KHigh and mCherry+ mVenus-p27KNeg cells from 4T07, EMT6, and D2A1 tumors. Heatmaps show differentially expressed genes involved in stemness and chemotherapy resistance
(B) Pathway enrichment analysis from (A) showing top upregulated pathways by adjusted p value.
(C) Heatmap shows hypoxia-induced differentially expressed genes in (B). Data is color coded to reflect gene expression Z scores.
(D and E) Pimonidazole in 4T07 (D) and EMT6 (E) tumors expressing mVenus-p27K (n = 3 mice/model).
(F) Pimonidazole in GFP:mCherry 4T07 tumors 7 days after treatment with 5M Jedi T cells (n = 5 mice).
(G) Mean ± SEM of mean fluorescent intensity (MFI) of 2-NBD-glucose (n = 3 mice). ***p < 0.001.

