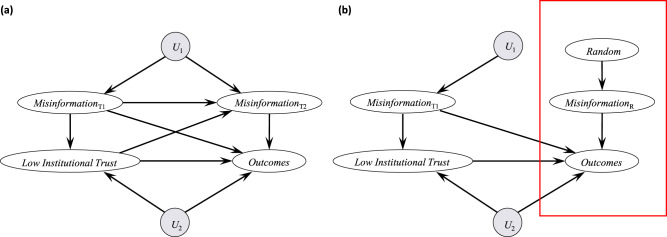
Fig. 1. Directed acyclic graphs illustrating causal networks of misinformation effects.
a Directed acyclic graphs are graphical causal models characterized by nodes representing variables and edges representing direct causal effects. In the example, both low institutional trust and misinformation can cause outcomes such as vaccine hesitancy. Additionally, low trust and misinformation can have cross-lagged effects (e.g. low trust at Time 1 causes more misinformation at Time 2), and there are likely other relevant factors (U1 and U2; e.g. technological and economic conditions, state capacity, or specific events); b Research leveraging randomization, on average, controls for spurious factors and allows causal identification for a subset of misinformation (MisinformationR). However, many studies tend to focus on a limited timescale, estimating only specific direct effects and not total effects (e.g. nodes and arrows within the red box, where the effects of prior misinformation and other context factors (U2) might not be captured).

