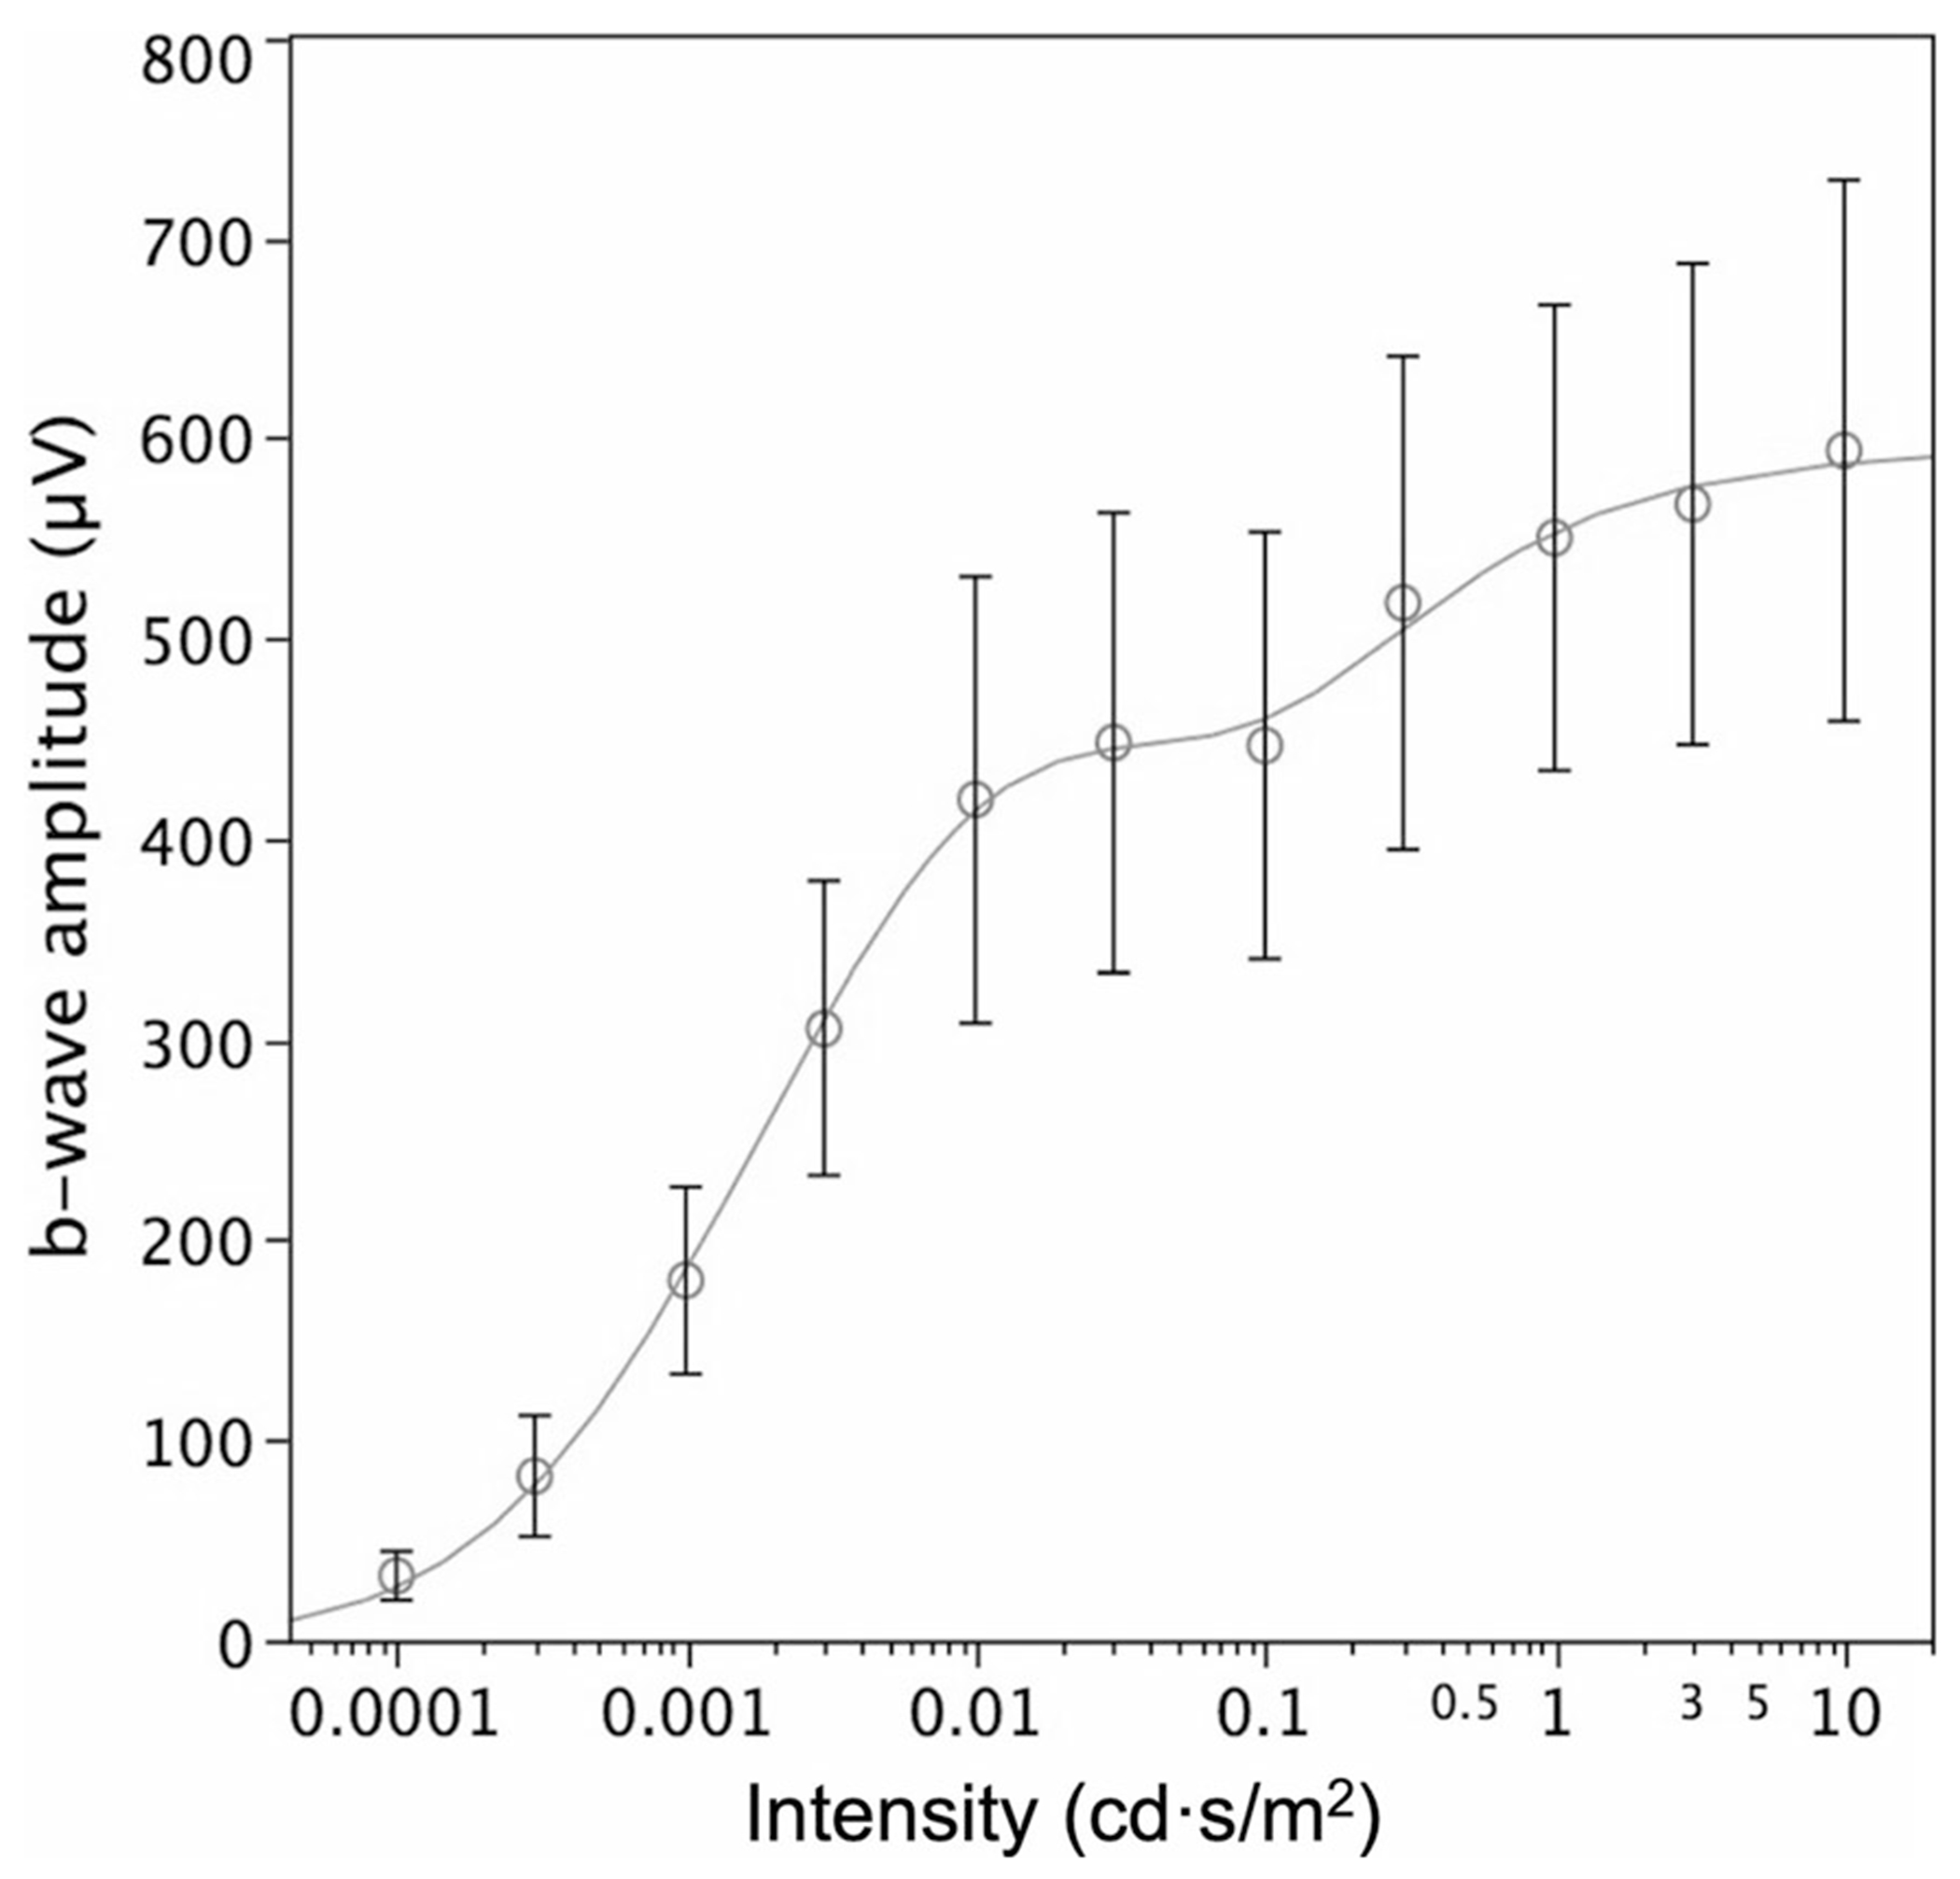
Fig. 4.

An example of flash stimulus–response amplitude data for DA ERG b-waves averaged from 85 healthy subjects to flashes of increasing strength (intensity). Circles are averages, error bars the 95% confidence limits, and the line a mathematical model that includes the second limb, seen in all normal subjects tested above flash strengths of approximately 0.1 cd·s/m2
