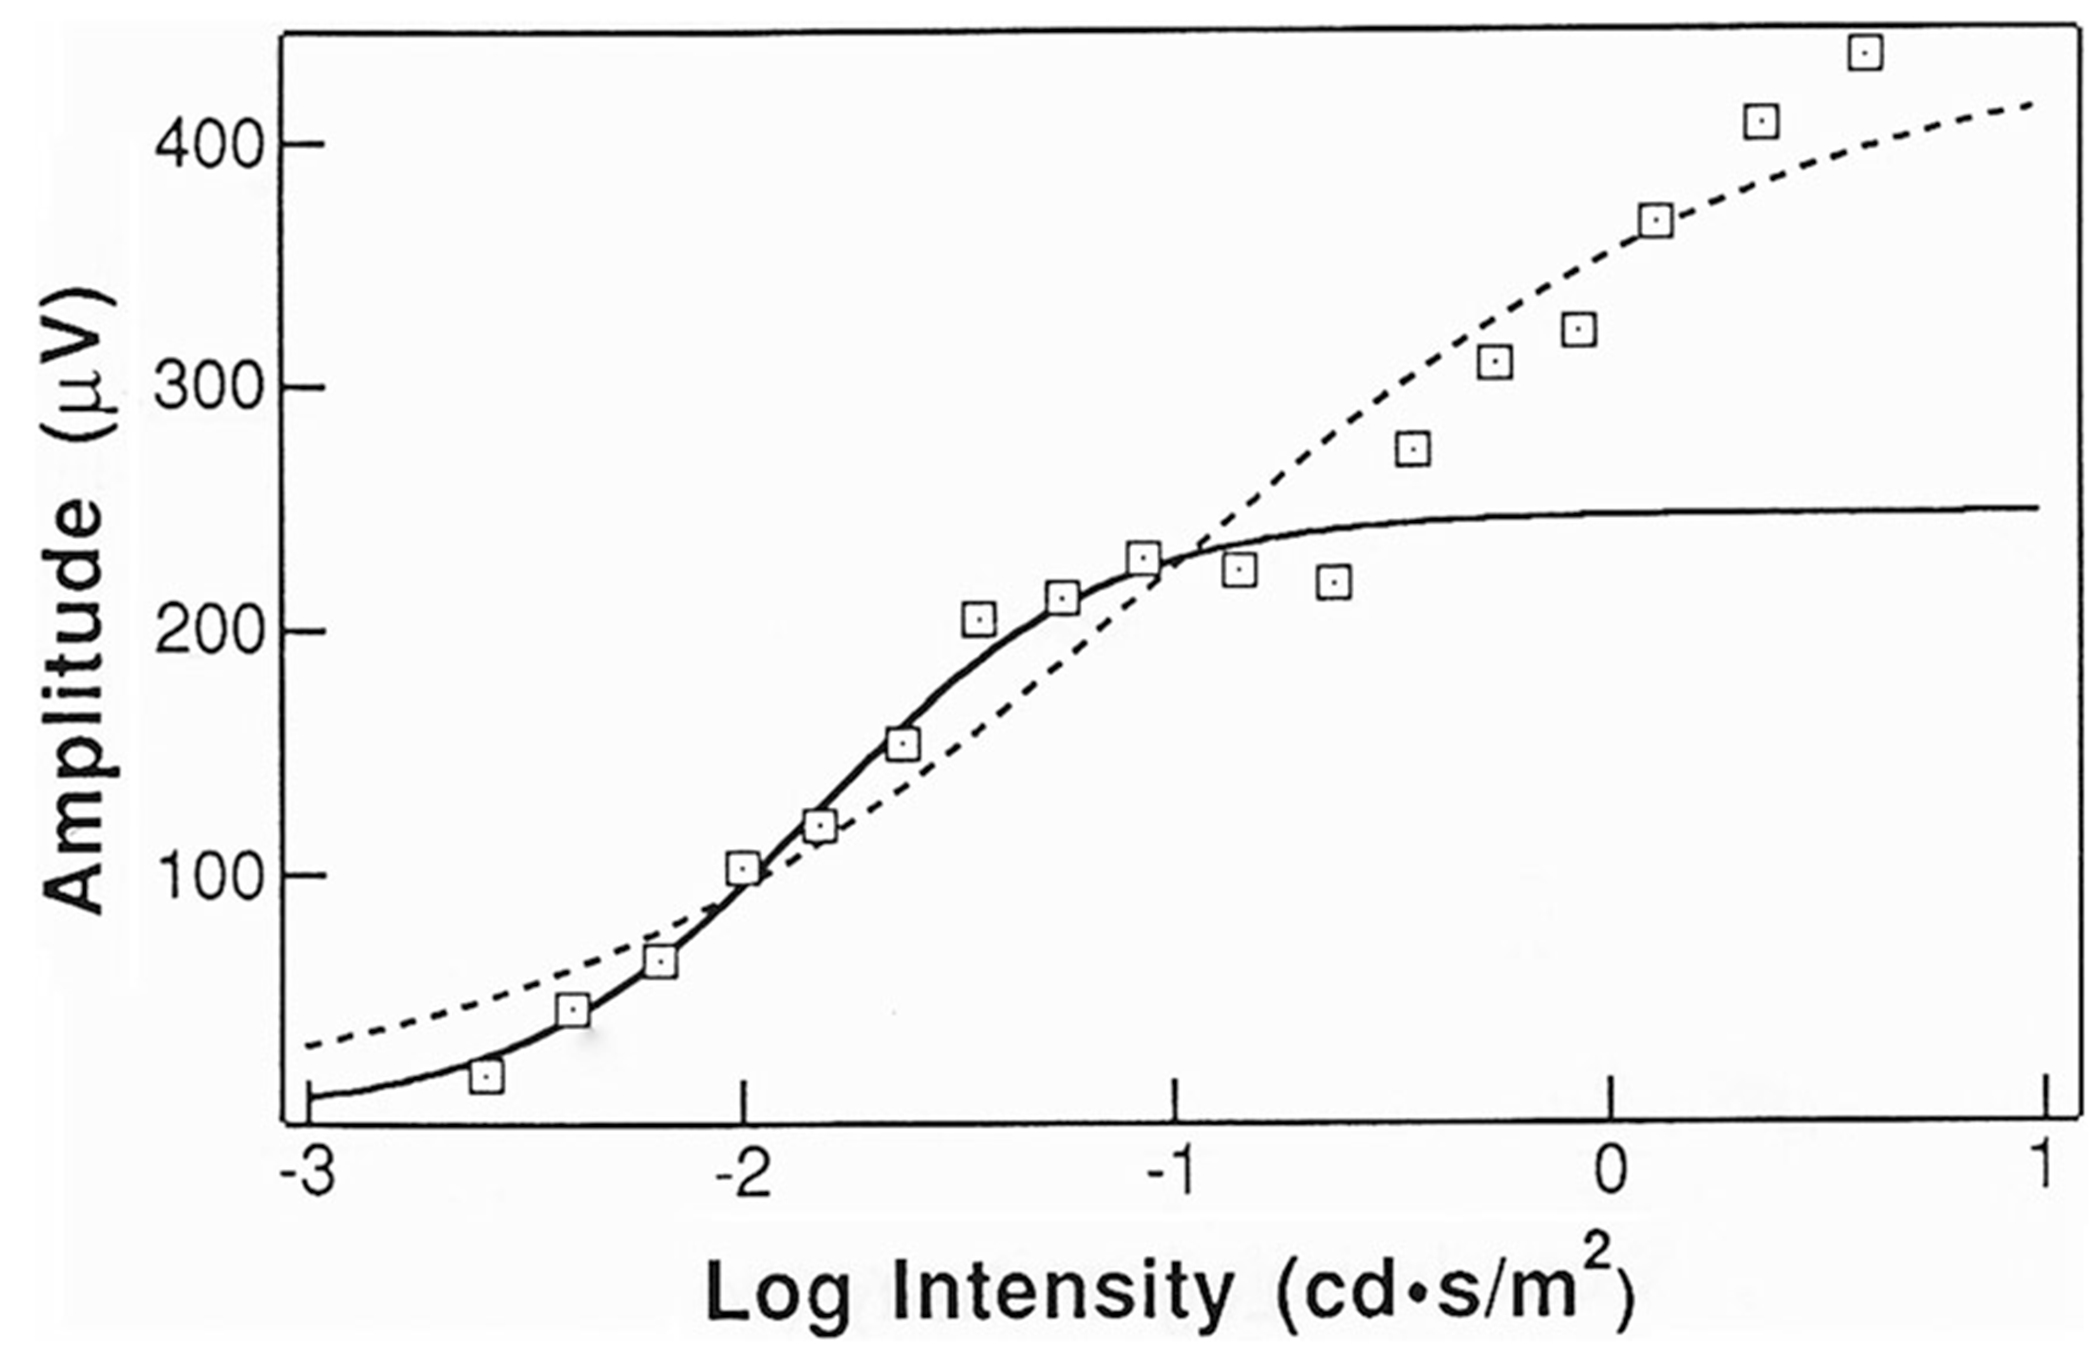
Fig. 5.

Example of ERG b-wave stimulus–response data, fit by single Naka–Rushton equations to all of the data (dashed line) and to just the first limb (solid line). Figure reprinted with permission of Springer Nature (Documenta Ophthalmologica 85 [2] pp. 135–150). The care and fitting of Naka–Rushton functions to electroretinographic intensity–response data (Severns ML, Johnson, MA, Copyright 1993) [42]
