
Fig. 3. ATF4-deficient hepatocytes are ferroptosis susceptible.
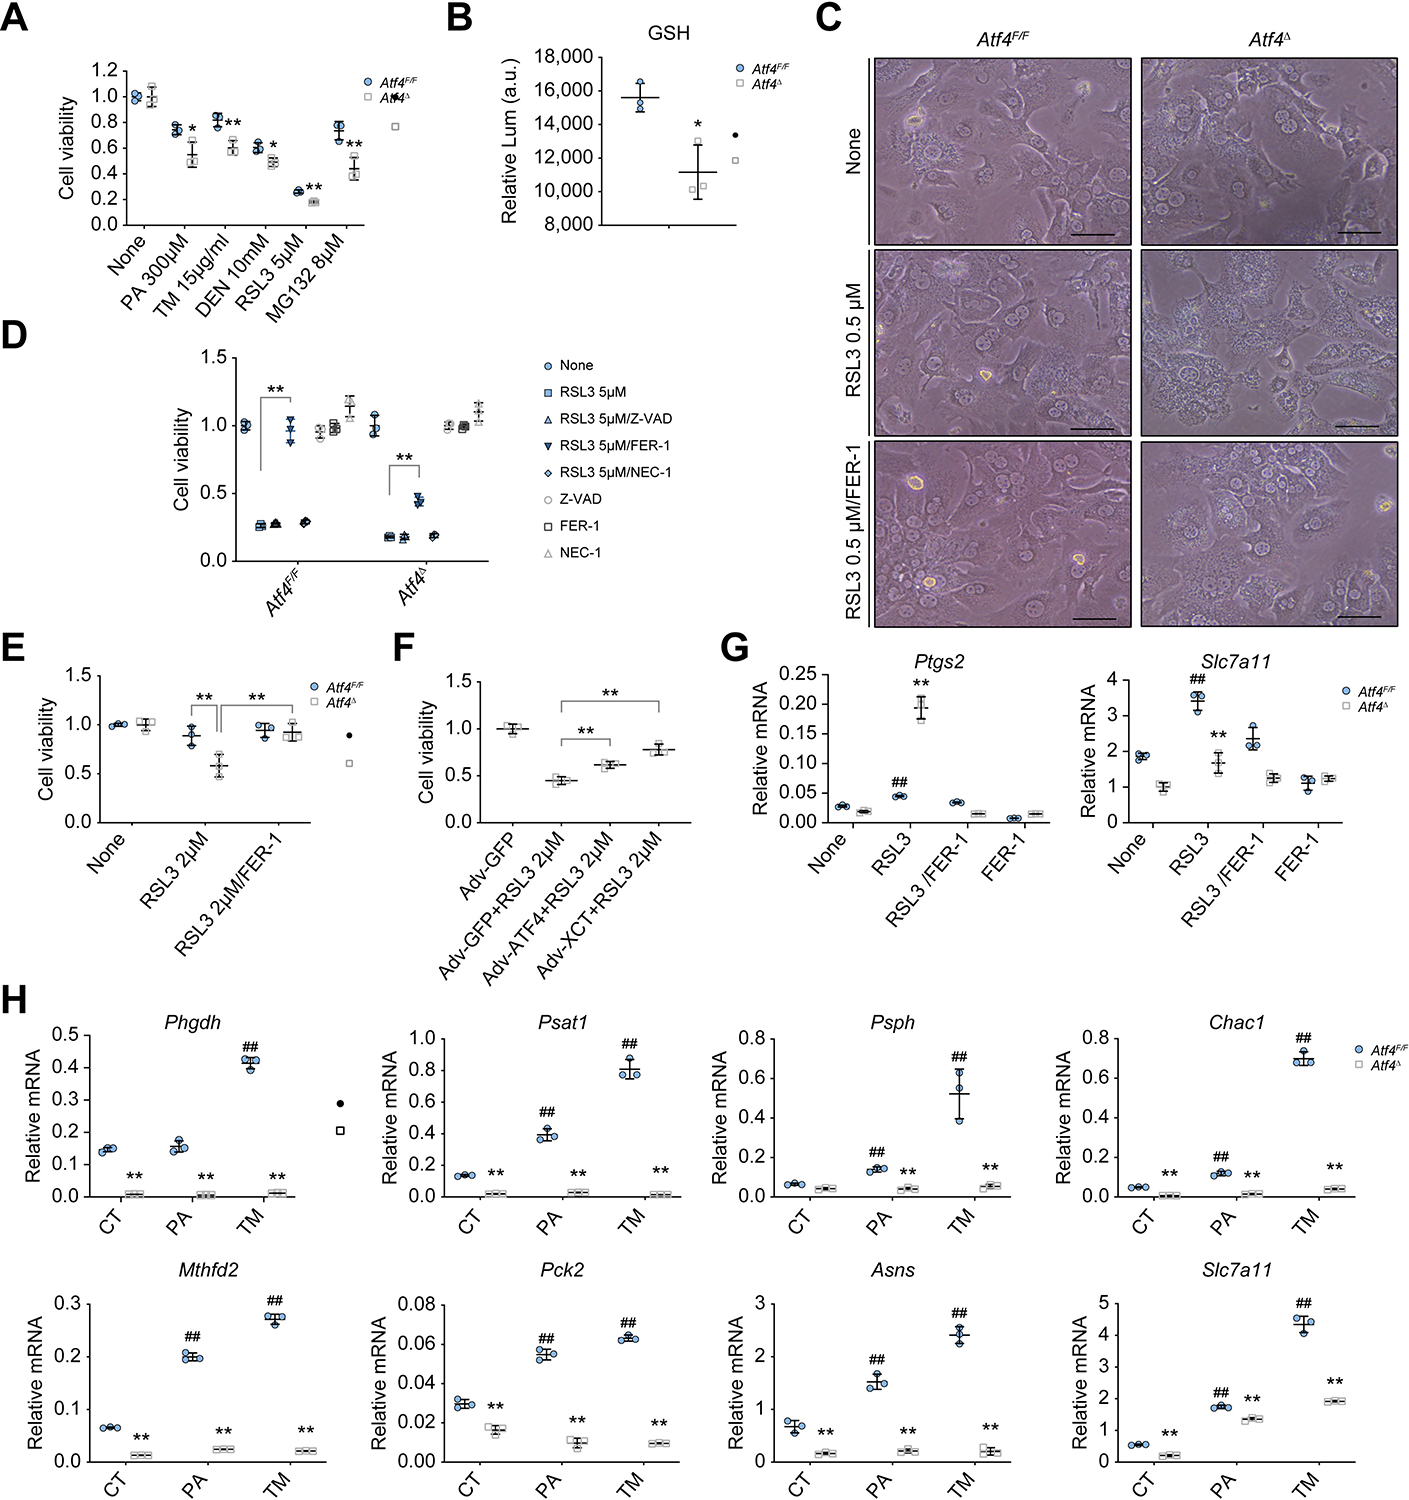
(A) Viability of Atf4F/F and Atf4Δ hepatocytes exposed to different cell death inducers. *p <0.05; **p <0.01 (vs. Atf4F/F, Student’s t test). (B) Relative GSH levels in above hepatocytes. (C) Representative images showing morphology of Atf4F/F and Atf4Δ hepatocytes treated with vehicle control (NONE) or 0.5 μM RSL3 in the absence or presence of 10 μM FER-1 for 10 h. Scale bars, 50 μm. (D) Viability of above hepatocytes treated without or with 5 μM RSL3 in the absence or presence of 50 μM Z-VAD, 10 μM FER-1, or 10 μM NEC-1 for 10 h. (E) Viability of Atf4F/F and Atf4Δ hepatocytes treated without or with 2 μM RSL3 or 2 μM RSL3 plus 10 μM FER-1 for 10 h. (F) Viability of Atf4Δ hepatocytes transduced with Adv-GFP, Adv-ATF4, or Adv-xCT 24 h before culturing in the presence of 2 μM RSL3, as indicated. **p <0.01 (Student’s t test). (G) qRT-PCR analysis of Ptgs2 and Slc7a11 mRNAs in Atf4F/F and Atf4Δ hepatocytes treated with NONE, 0.5 μM RSL3, 10 μM FER-1, or a 0.5 μM RSL3 plus 10 μM FER-1 combo for 8 h. **p <0.01 (vs. Atf4F/F, Student’s t test). ##p <0.01 (vs. NONE of Atf4F/F, Student’s t test). (H) qRT-PCR analysis of mRNA expression in Atf4F/F and Atf4Δ hepatocytes treated with NONE, 300 μM PA, or 4 μg/ml TM for 10 h. Mean ± SD (n = 3/group). **p <0.01 (vs. Atf4F/F, Student’s t test). ##p <0.01 (vs. CT of Atf4F/F, Student’s t test). Adv, adenovirus; AFT4, activating transcription factor 4; CT, Control; DEN, diethylnitrosamine; FER-1, ferrostatin-1; GSH, reduced glutathione; Lum, luminescence; NEC-1, necrostatin-1; PA, palmitic acid; RSL3, RAS-selective lethal 3; TM, tunicamycin.