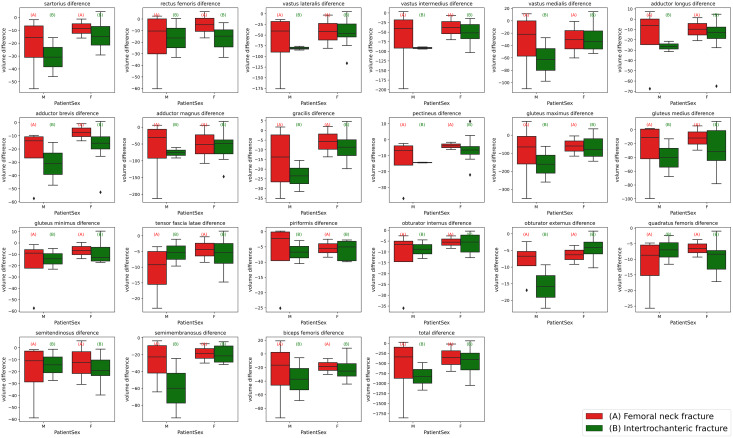
Figure 6. Box plots of individual muscle volume loss based on fracture types.
The variations in thigh muscle volume derived from segmentation analyses of pre-operative and post-operative CT scans, categorized by type of hip fracture. The red (A) plots represent patients with femoral neck fractures, while the green (B) plots correspond to those with intertrochanteric fractures. The left side of each plot grouping depicts the male cohort, and the right side represents the female cohort.

