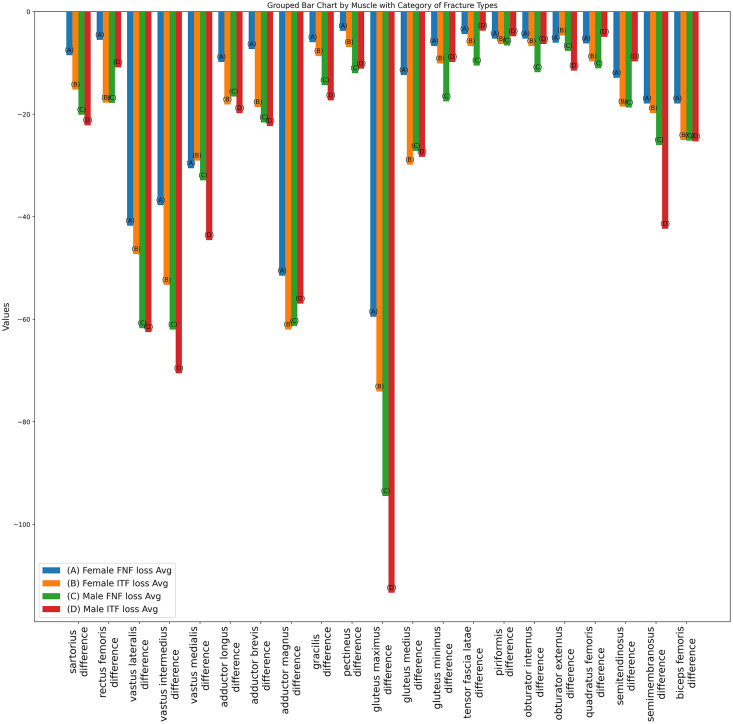
Figure 7. Bar plot of individual muscle volume loss based on fracture types.
The average individual thigh muscle volume differences, as obtained from segmentation results between pre-operative and post-operative CT scans, categorized by types of hip fracture. The blue (A) bars represent the subgroup of females with femoral neck fractures, orange (B) bars denote males with femoral neck fractures, green (C) bars correspond to females with intertrochanteric fractures, and red (D) bars indicate males with intertrochanteric fractures.

